 The state of New Jersey began considering legal casino gambling in the 1970s, with voters in the Garden State casting ballots on the issue for the first time on November 5, 1974. Back then, 60% of voters opposed the measure. A second referendum was held in 1976, and this time casino gambling was approved, but only for Atlantic City. The first casino facility to open its doors in Atlantic City was Resorts International, which started welcoming visitors on May 26, 1978.
Nowadays, Atlantic City has nine land-based casinos, several racetracks, and eight licensees with internet gambling permits. While the online gaming industry has been the predominant driver of the Garden State’s gambling revenue growth in recent years, land-based gaming and sports betting in Atlantic City have also helped New Jersey compete with other states such as Nevada and Pennsylvania, where the gambling industry is expanding rapidly.
Monthly Revenue Reports for Atlantic City’s Gambling Sector
 The beginning of 2023 brought a strong start for the gaming industry in Atlantic City, with total GGR showing significant year-over-year growth in January. The following months continued the upward trend, and the first half of the year has already surpassed the results for all of 2022.
January Gaming Revenue in Atlantic City
Atlantic City casinos, racetracks, and their partners reported total gaming revenue of $436.9 million for January 2023. This figure represents a 14.5% increase compared with the $381.7 million generated in January 2022.
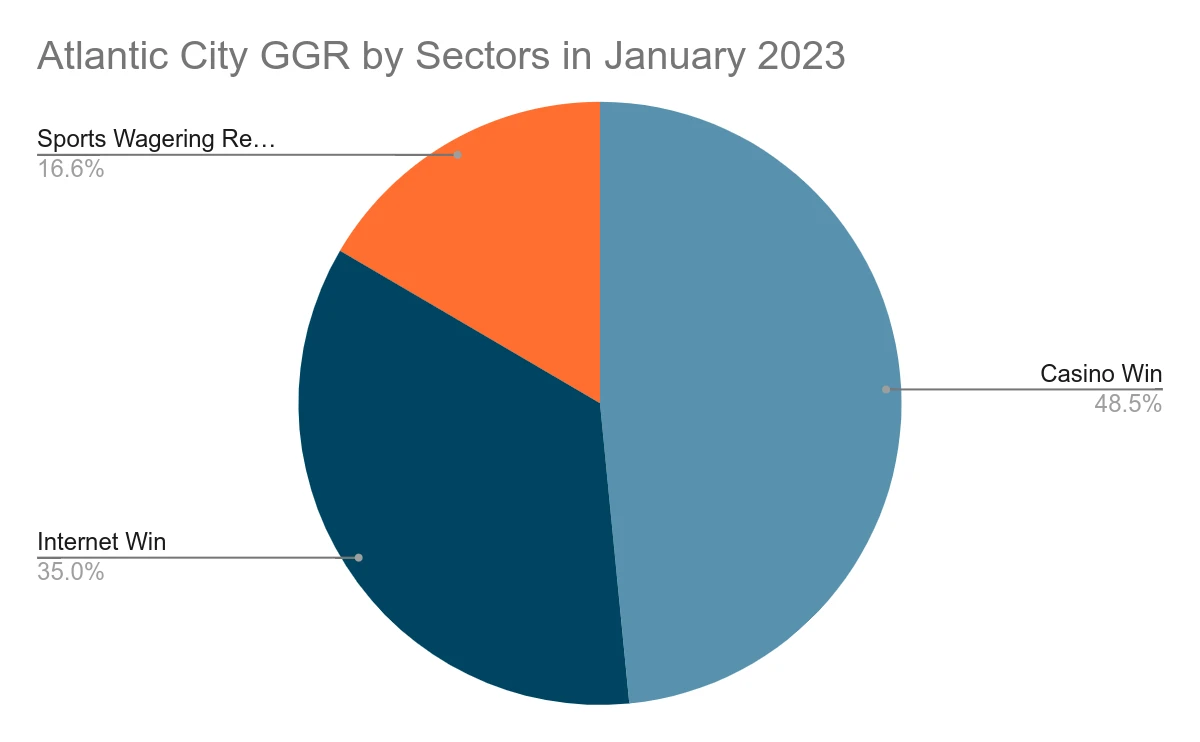
Total gambling revenue for January 2023 comprised casino wins of $211.7 million, internet wins of $152.9 million, and sports wagering revenue of $72.3 million.
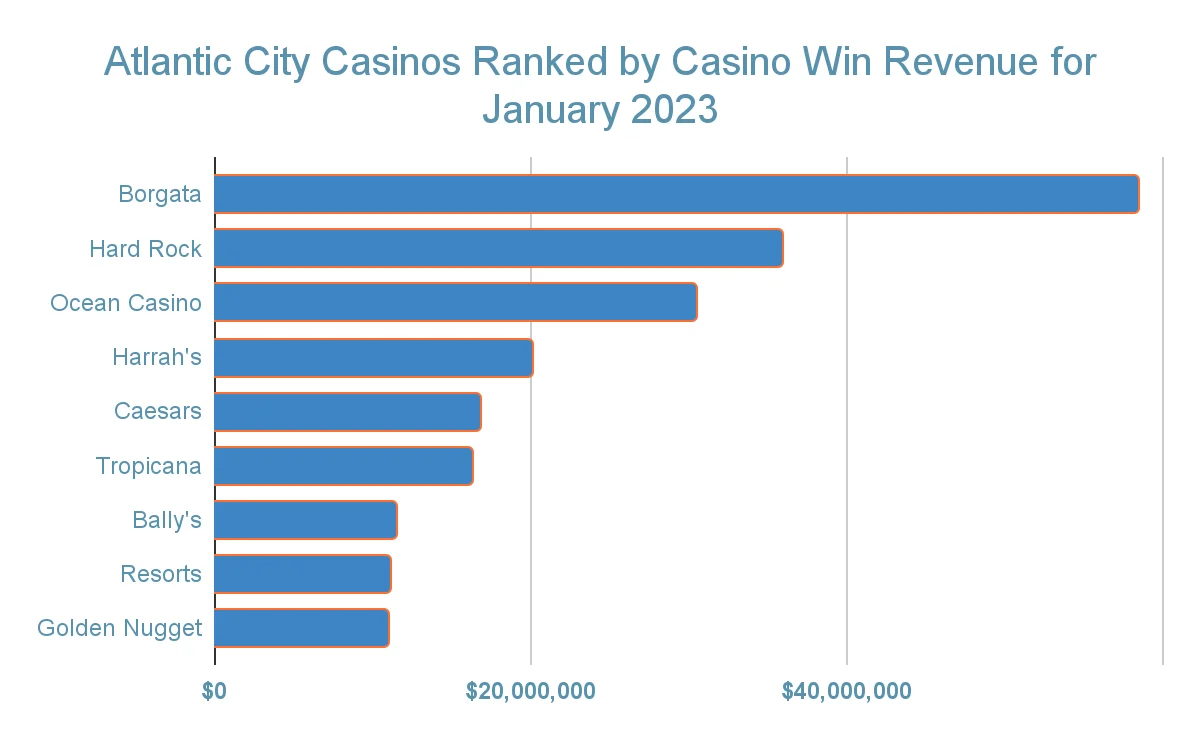
| January 2023 Casino Win Revenue | |||
|---|---|---|---|
| Casino Licensee | 2023 | 2022 | Increase/Decrease % |
| Bally’s | $11,544,104.00 | $8,783,616.00 | 31.4 |
| Borgata | $58,372,133.00 | $48,396,497.00 | 20.6 |
| Caesars | $16,803,862.00 | $16,000,610.00 | 5 |
| Golden Nugget | $10,992,399.00 | $10,411,133.00 | 5.6 |
| Hard Rock | $35,910,042.00 | $34,732,681.00 | 3.4 |
| Harrah’s | $20,154,773.00 | $17,388,034.00 | 15.9 |
| Ocean Casino | $30,524,247.00 | $24,141,729.00 | 26.4 |
| Resorts | $11,109,015.00 | $9,249,743.00 | 20.1 |
| Tropicana | $16,264,674.00 | $14,537,724.00 | 11.9 |
| Total: | $211,675,249.00 | $183,641,767.00 | 15.3 |
- Borgata with $58.4 million in casino wins
- Hard Rock with $35.9 million in casino wins
- Harrah’s with $20.2 million in casino wins
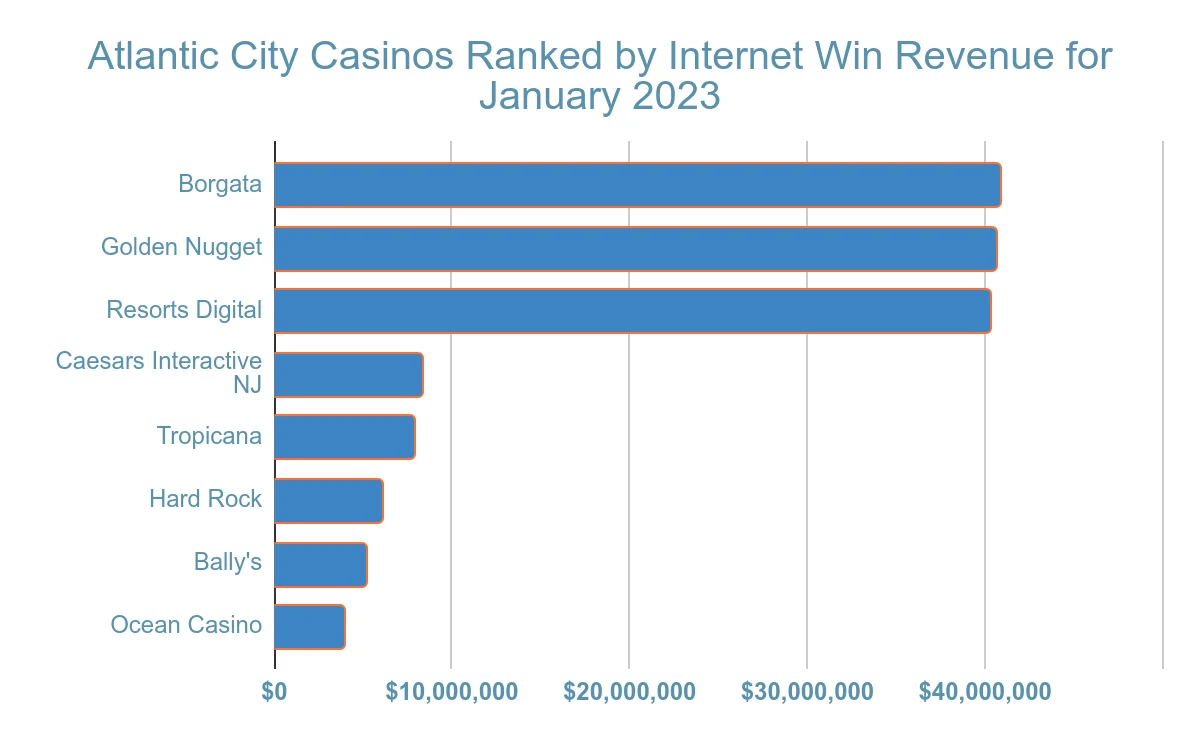
| Atlantic City Internet Win Revenue January 2023 | |||
|---|---|---|---|
| Casino Licensee | 2023 | 2022 | Change % |
| Bally’s | $5,140,854.00 | $1,203,793.00 | 327.1 |
| Borgata | $40,798,884.00 | $39,108,303.00 | 4.3 |
| Caesars Interactive NJ (online-only) | $8,272,822.00 | $10,045,743.00 | -17.6 |
| Golden Nugget/ Golden Nugget Online Gaming | $40,596,496.00 | $36,485,877.00 | 11.3 |
| Hard Rock | $6,047,782.00 | $6,447,054.00 | -6.2 |
| Ocean Casino | $3,937,612.00 | $1,907,261.00 | 106.5 |
| Resorts Digital (online-only) | $40,222,698.00 | $33,023,836.00 | 21.8 |
| Tropicana | $7,849,669.00 | $9,627,849.00 | -18.5 |
| Total: | $152,866,817.00 | $137,849,716.00 | 10.9 |
- Borgata with online casino revenue of $40.8 million
- Golden Nugget with online casino revenue of $40.6 million
- Resorts Digital with internet wins of $40.2 million
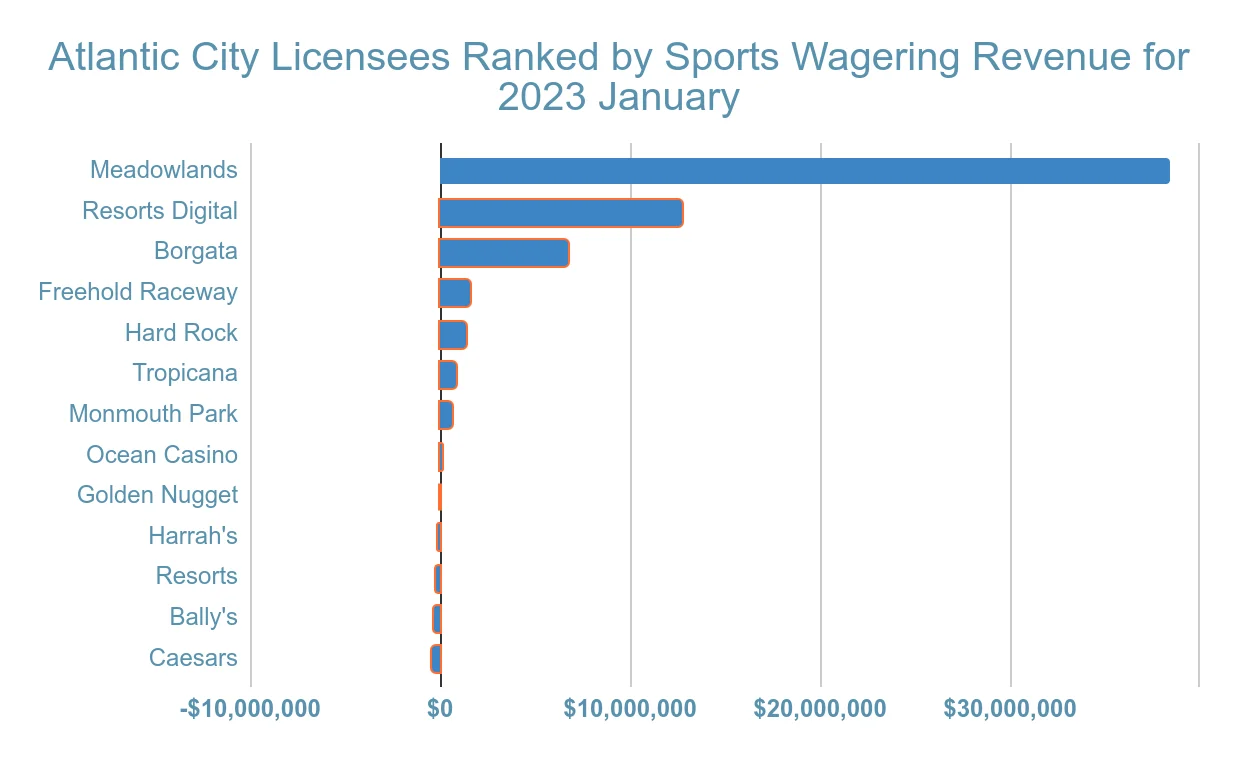
| January 2023 Sports Wagering Revenue | |||
|---|---|---|---|
| Licensee | 2023 | 2022 | Change % |
| Bally’s | -$284,268.00 | $29,200.00 | -1073.5 |
| Borgata | $6,779,867.00 | $4,853,033.00 | 39.7 |
| Caesars | -$450,392.00 | $5,486.00 | -8309.8 |
| Golden Nugget | $21,335.00 | -$29,208.00 | 173 |
| Hard Rock | $1,327,684.00 | $1,181,776.00 | 12.3 |
| Harrah’s | -$72,189.00 | $149,791.00 | -148.2 |
| Ocean Casino | $149,364.00 | $371,131.00 | -59.8 |
| Resorts | -$212,105.00 | $272,773.00 | -177.8 |
| Resorts Digital (online-only) | $12,689,581.00 | $10,166,691.00 | 24.8 |
| Tropicana | $874,399.00 | $1,619,047.00 | -46 |
| Racetracks | $51,507,163.00 | $41,576,182.00 | 23.9 |
| Total: | $72,330,439.00 | $60,195,902.00 | 20.2 |
- Meadowlands with sports betting revenue of $38.4 million
- Resorts Digital with sports wagering revenue of $12.7 million
- Borgata with $6.8 million in sports betting revenue
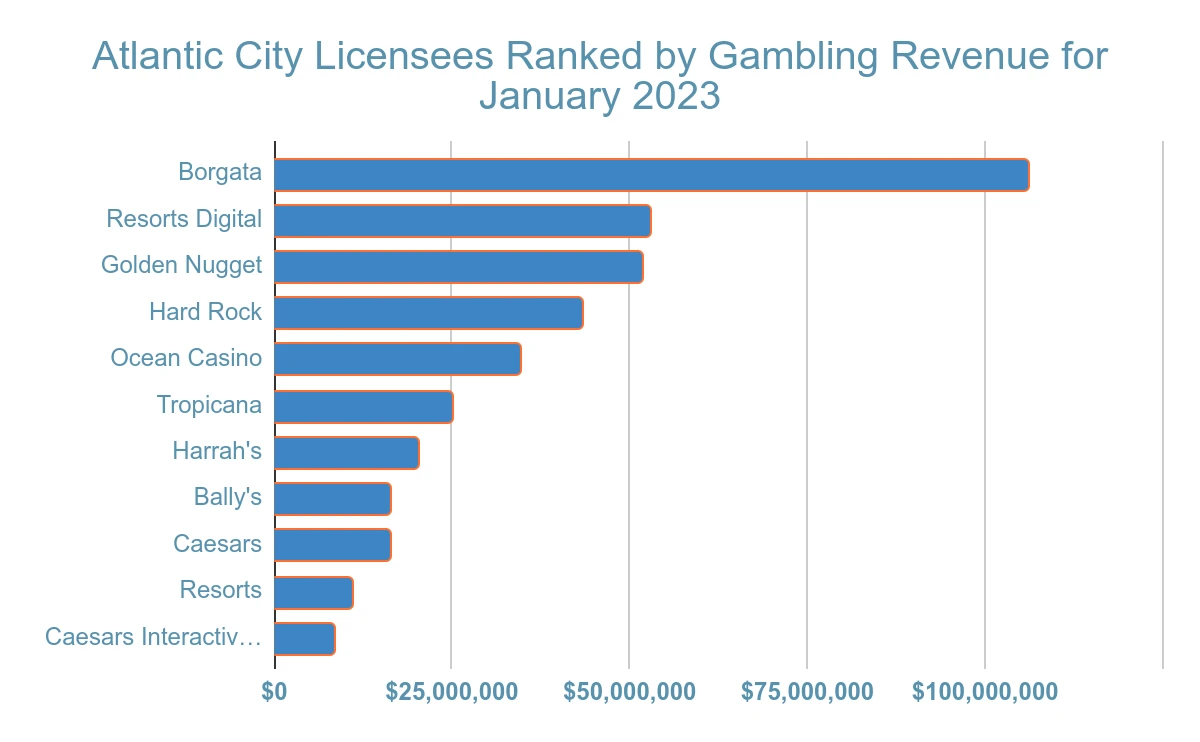
| Atlantic City Total Gaming Revenue January 2023 | |||
|---|---|---|---|
| Licensee | 2023 | 2022 | Change % |
| Bally’s | $16,400,690.00 | $10,016,609.00 | 63.7 |
| Borgata | $105,950,884.00 | $92,357,833.00 | 14.7 |
| Caesars | $16,353,470.00 | $16,006,096.00 | 2.2 |
| Caesars Interactive NJ | $8,272,822.00 | $10,045,743.00 | -17.6 |
| Golden Nugget | $51,610,230.00 | $46,867,802.00 | 10.1 |
| Hard Rock | $43,285,508.00 | $42,361,511.00 | 2.2 |
| Harrah’s | $20,082,584.00 | $17,537,825.00 | 14.5 |
| Ocean Casino | $34,611,223.00 | $26,420,121.00 | 31 |
| Resorts | $10,896,910.00 | $9,522,516.00 | 14.4 |
| Resorts Digital (online-only) | $52,912,279.00 | $43,190,527.00 | 22.5 |
| Tropicana | $24,988,742.00 | $25,784,620.00 | -3.1 |
| Racetracks | $51,507,163.00 | $41,576,182.00 | 23.9 |
| Total: | $436,872,505.00 | $381,687,385.00 | 14.5 |
When we consider the total gaming revenue reported by each casino licensed to operate in Atlantic City in January 2023, we see that the three companies with the highest figures were:
- Borgata with almost $106 million
- Resorts Digital with a little under $53 million
- Golden Nugget with $51.6 million
February Gaming Revenue in Atlantic City
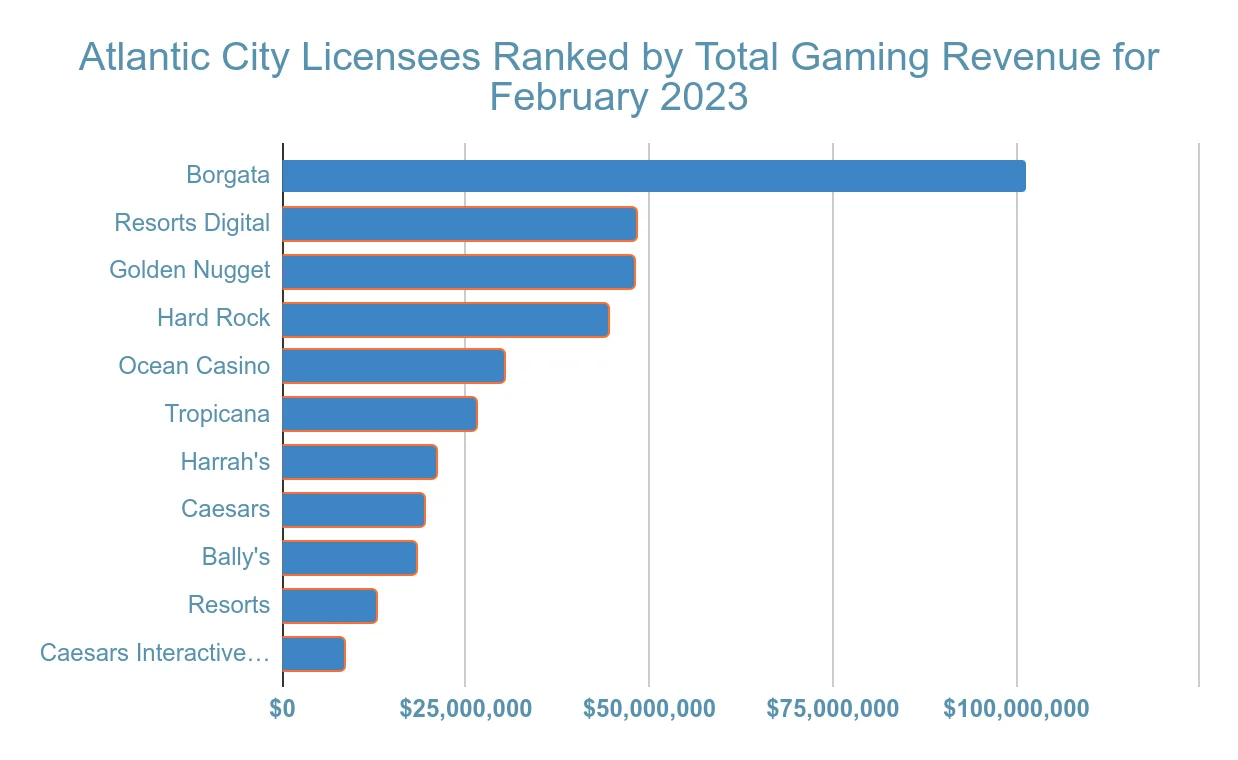
The nine licensed casino brands, racetracks, and their partners operating in Atlantic City reported gaming revenue of $412.2 million for February 2023, a 10.4% increase over the $373.3 million recorded in February 2022. Year-to-date, casinos, racetracks, and their partners generated $849.1 million, up 12.5% from $755.0 million in the prior period.
Total gaming revenue for February 2023 comprised casino wins of $215.0 million, sports wagering revenue of $54.6 million, and internet wins of $142.6 million.
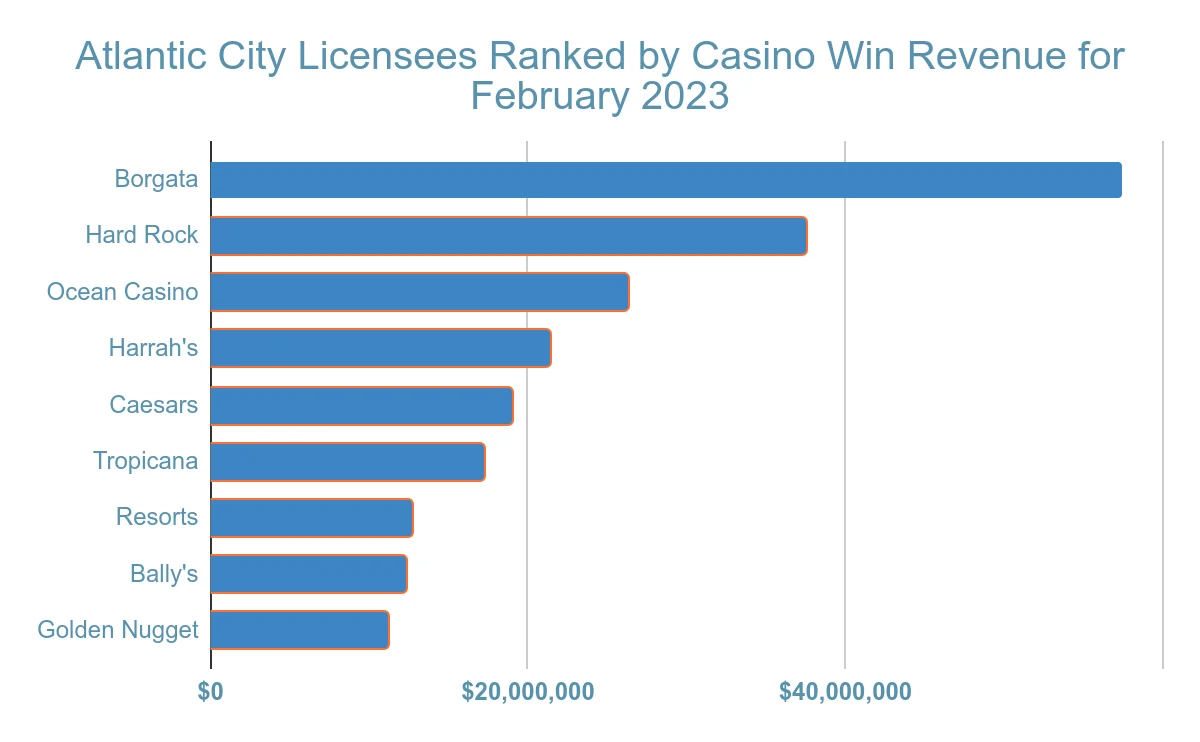
| February 2023 Casino Win Revenue | |||
|---|---|---|---|
| Casino Licensee | 2023 | 2022 | Change % |
| Bally’s | $12,269,167.00 | $10,736,761.00 | 14.3 |
| Borgata | $57,475,769.00 | $52,840,605.00 | 8.8 |
| Caesars | $19,004,647.00 | $18,749,699.00 | 1.4 |
| Golden Nugget | $11,163,992.00 | $12,964,359.00 | -13.9 |
| Hard Rock | $37,511,642.00 | $37,397,436.00 | 0.3 |
| Harrah’s | $21,387,053.00 | $19,782,712.00 | 8.1 |
| Ocean Casino | $26,293,994.00 | $29,694,397.00 | -11.5 |
| Resorts | $12,647,392.00 | $12,910,482.00 | -2 |
| Tropicana | $17,214,838.00 | $17,342,414.00 | -0.7 |
| Total: | $214,968,494.00 | $212,418,865.00 | 1.2 |
- Borgata with casino wins of $57.5 million
- Hard Rock with casino revenue of $37.5 million
- Ocean Casino with casino wins of $26.3 million
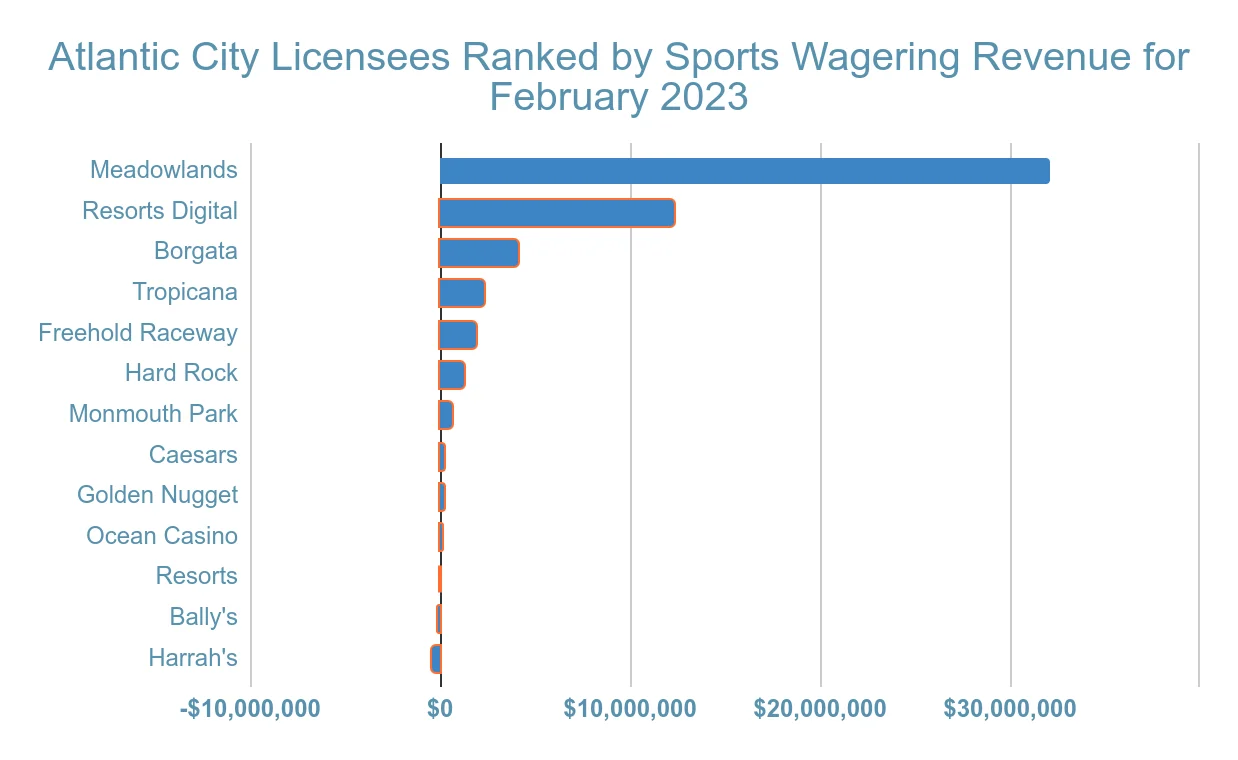
| February 2023 Sports Wagering Revenue | |||
|---|---|---|---|
| Licensee | 2023 | 2022 | Change % |
| Bally’s | -$83,738.00 | $79,991.00 | -204.7 |
| Borgata | $4,052,407.00 | $3,644,132.00 | 11.2 |
| Caesars | $252,687.00 | $366,399.00 | -31 |
| Golden Nugget | $174,715.00 | $379,114.00 | -53.9 |
| Hard Rock | $1,274,397.00 | $1,322,676.00 | -3.7 |
| Harrah’s | -$387,672.00 | -$225,486.00 | 71.9 |
| Ocean Casino | $56,436.00 | $22,150.00 | 154.8 |
| Resorts | -$2,825.00 | $451,455.00 | -100.6 |
| Resorts Digital (online-only) | $12,296,613.00 | $8,622,138.00 | 42.6 |
| Tropicana | $2,344,689.00 | -$329,788.00 | 811 |
| Racetracks | $34,643,511.00 | $16,540,588.00 | 109.4 |
| Total with racetracks: | $54,621,220.00 | $30,873,369.00 | 76.9 |
- Meadowlands with sports betting revenue of $32.0 million
- Resorts Digital with sports wagering wins of $12.3 million
- Borgata with sports wagering revenue of $4.0 million
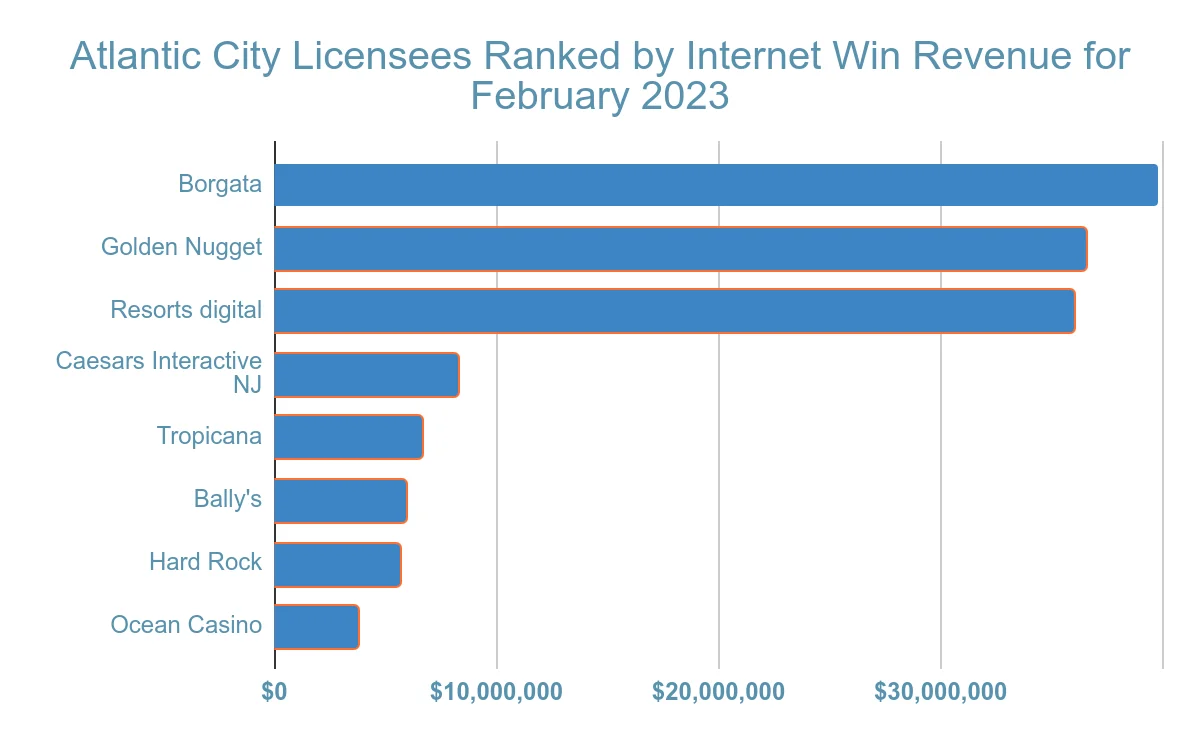
| Atlantic City Internet Win Revenue February 2023 | |||
|---|---|---|---|
| Casino Licensees | 2023 | 2022 | Change % |
| Bally’s | $5,939,768.00 | $1,349,525.00 | 340.1 |
| Borgata | $39,736,855.00 | $37,831,314.00 | 5 |
| Caesars Interactive NJ | $8,309,315.00 | $10,066,088.00 | -17.5 |
| Golden Nugget/ Golden Nugget Online Gaming | $36,541,825.00 | $34,560,269.00 | 5.7 |
| Hard Rock | $5,619,451.00 | $6,045,686.00 | -7.1 |
| Ocean Casino | $3,794,936.00 | $1,120,750.00 | 238.6 |
| Resorts Digital | $35,964,598.00 | $29,902,791.00 | 20.3 |
| Tropicana | $6,686,218.00 | $9,099,668.00 | -26.5 |
| Total: | $142,592,966.00 | $129,976,091.00 | 9.7 |
- Borgata with internet wins of $39.7 million
- Golden Nugget with online casino revenue of $36.5 million
- Resorts Digital with internet wins of $36.0 million
| Atlantic City Total Gaming Revenue February 2023 | |||
|---|---|---|---|
| Licensee | 2023 | 2022 | Change % |
| Bally’s | $18,125,197.00 | $12,166,277.00 | 49 |
| Borgata | $101,265,031.00 | $94,316,051.00 | 7.4 |
| Caesars | $19,257,334.00 | $19,116,098.00 | 0.7 |
| Caesars Interactive NJ | $8,309,315.00 | $10,066,088.00 | -17.5 |
| Golden Nugget | $47,880,532.00 | $47,903,742.00 | 0 |
| Hard Rock | $44,405,490.00 | $44,765,798.00 | -0.8 |
| Harrah’s | $20,999,381.00 | $19,557,226.00 | 7.4 |
| Ocean Casino | $30,145,366.00 | $30,837,297.00 | -2.2 |
| Resorts | $12,644,567.00 | $13,361,937.00 | -5.4 |
| Resorts Digital (online-only) | $48,261,211.00 | $38,524,929.00 | 25.3 |
| Tropicana | $26,245,743.00 | $26,112,294.00 | 0.5 |
| Racetracks: | $34,643,511.00 | $16,540,588.00 | 109.4 |
| Total: | $412,182,678.00 | $373,268,325.00 | 10.4 |
- Borgata with a total gambling revenue of $101.3 million
- Resorts Digital with gambling revenue of $48.3 million
- Golden Nugget, which reported total gambling revenue of $47.9 million
March Gaming Revenue in Atlantic City
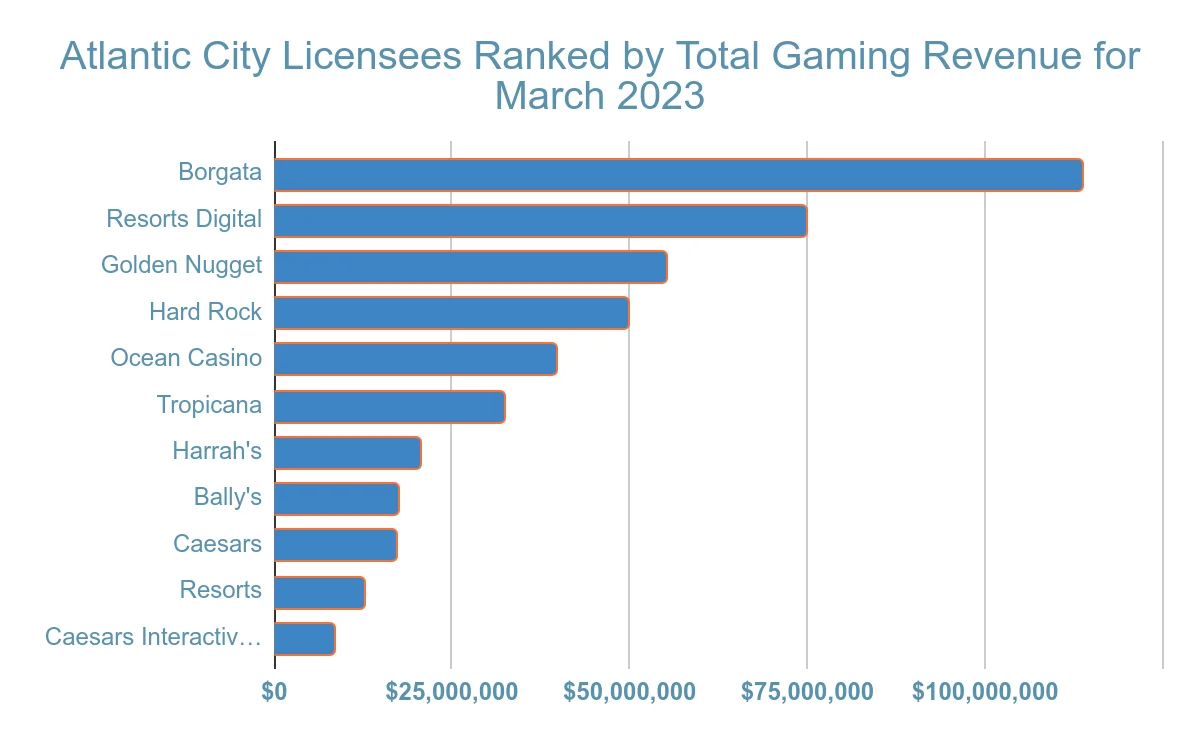
In March, Atlantic City’s casinos, racetracks, and their partners reported total gaming revenue of $487.4 million, a 15.0% increase over the $423.7 million recorded in March 2022. Year-to-date revenue reached $1.34 billion, a 13.4% rise from the $1.18 billion generated in the previous period.
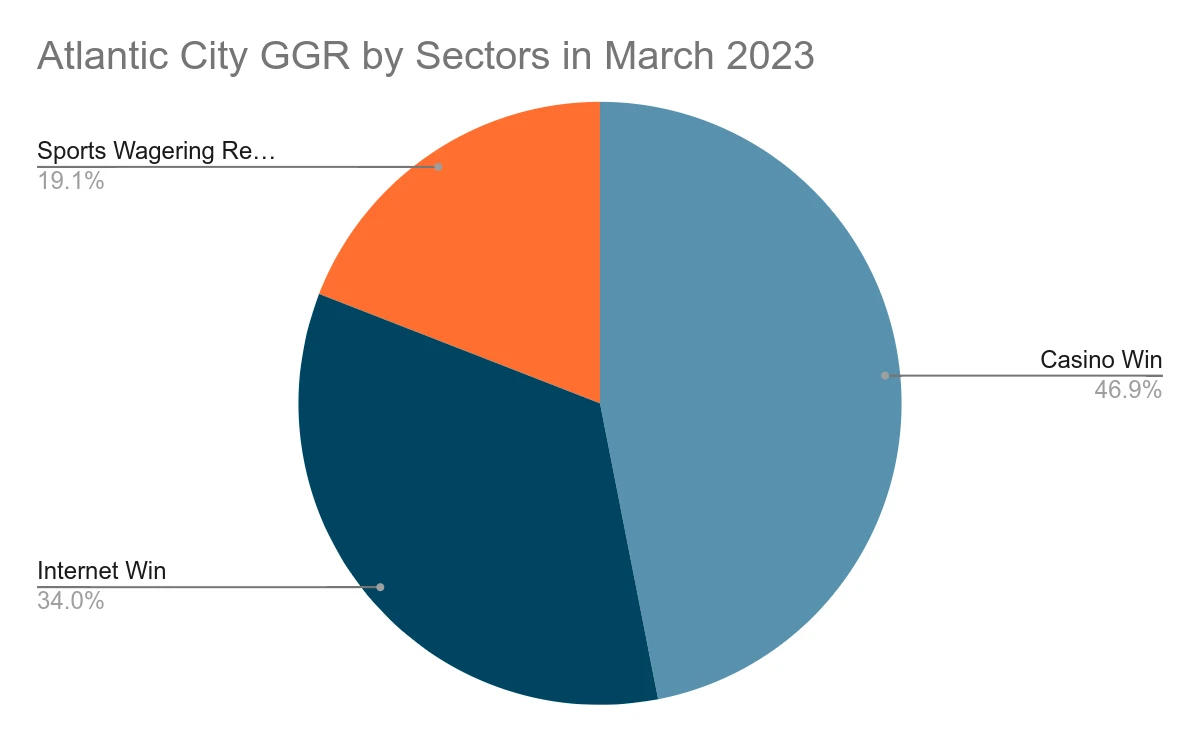
Total gaming revenue for March 2023 comprised casino wins of $228.6 million, sports wagering revenue of $93.0 million, and internet wins of $165.7 million.
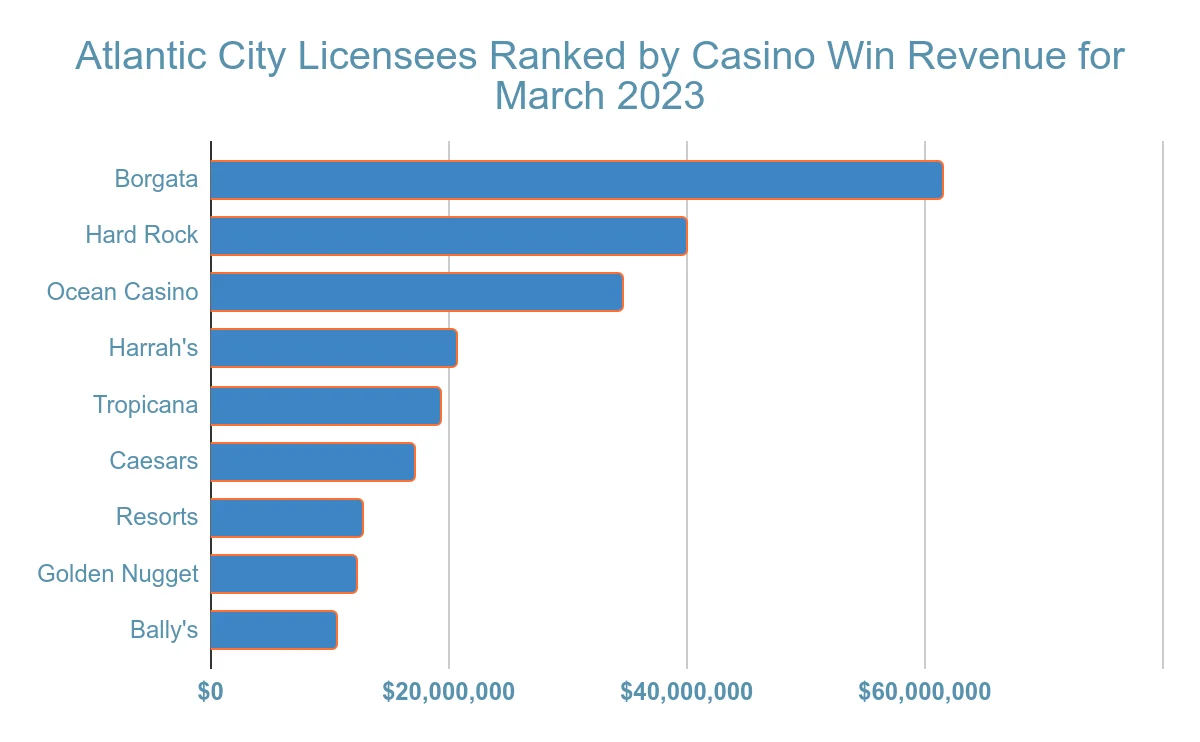
| March 2023 Casino Win Revenue | |||
|---|---|---|---|
| Casino Licensee | 2023 | 2022 | Change % |
| Bally’s | $10,550,249.00 | $13,478,256.00 | -21.7 |
| Borgata | $61,502,582.00 | $54,967,754.00 | 11.9 |
| Caesars | $17,140,999.00 | $18,462,870.00 | -7.2 |
| Golden Nugget | $12,266,501.00 | $12,619,103.00 | -2.8 |
| Hard Rock | $39,967,383.00 | $39,317,251.00 | 1.7 |
| Harrah’s | $20,622,053.00 | $20,010,365.00 | 3.1 |
| Ocean Casino | $34,605,232.00 | $25,420,654.00 | 36.1 |
| Resorts | $12,659,347.00 | $13,000,463.00 | -2.6 |
| Tropicana | $19,333,383.00 | $19,334,230.00 | 0 |
| Total: | $228,647,729.00 | $216,610,946.00 | 5.6 |
- Borgata with $61.5 million in casino revenue
- Hard Rock with nearly $40.0 million from casino operations
- Ocean Casino with casino wins of $34.6 million
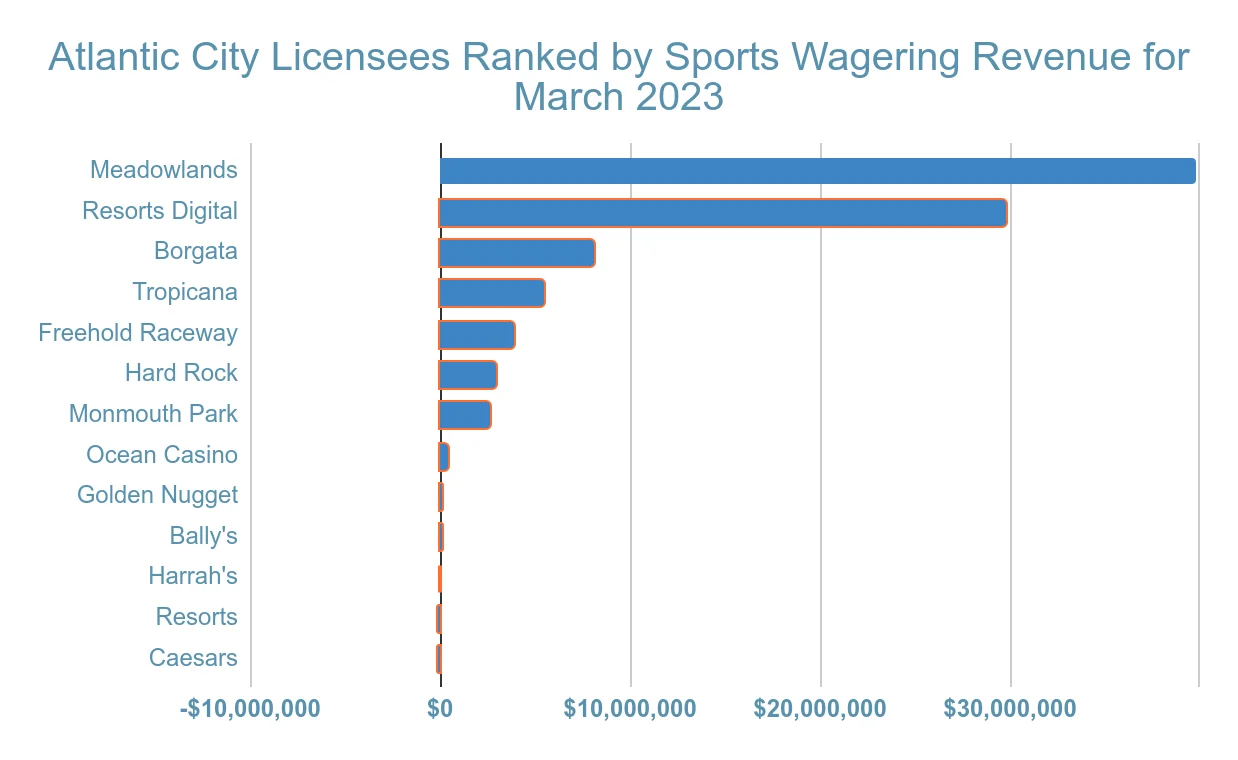
| March 2023 Sports Wagering Revenue | |||
|---|---|---|---|
| Licensee | 2023 | 2022 | Change % |
| Bally’s | $61,550.00 | $43,949.00 | 40 |
| Borgata | $8,152,991.00 | $10,606,176.00 | -23.1 |
| Caesars | -$119,056.00 | $441,413.00 | -127 |
| Golden Nugget | $104,033.00 | $219,960.00 | -52.7 |
| Hard Rock | $2,979,154.00 | $889,669.00 | 234.9 |
| Harrah’s | -$22,591.00 | $181,714.00 | -112.4 |
| Ocean Casino | $372,886.00 | $165,800.00 | 124.9 |
| Resorts | -$80,488.00 | $19,002.00 | -523.6 |
| Resorts Digital (online-only) | $29,792,977.00 | $11,746,474.00 | 153.6 |
| Tropicana | $5,420,268.00 | $1,313,189.00 | 312.8 |
| Racetracks | $46,378,275.00 | $40,777,024.00 | 13.7 |
| Total: | $93,039,999.00 | $66,404,370.00 | 40.1 |
- Meadowlands with reported sports wagering revenue of $39.8 million
- Resorts Digital with sports wagering revenue of $29.8 million
- Borgata with $8.2 million in sports wagering revenue
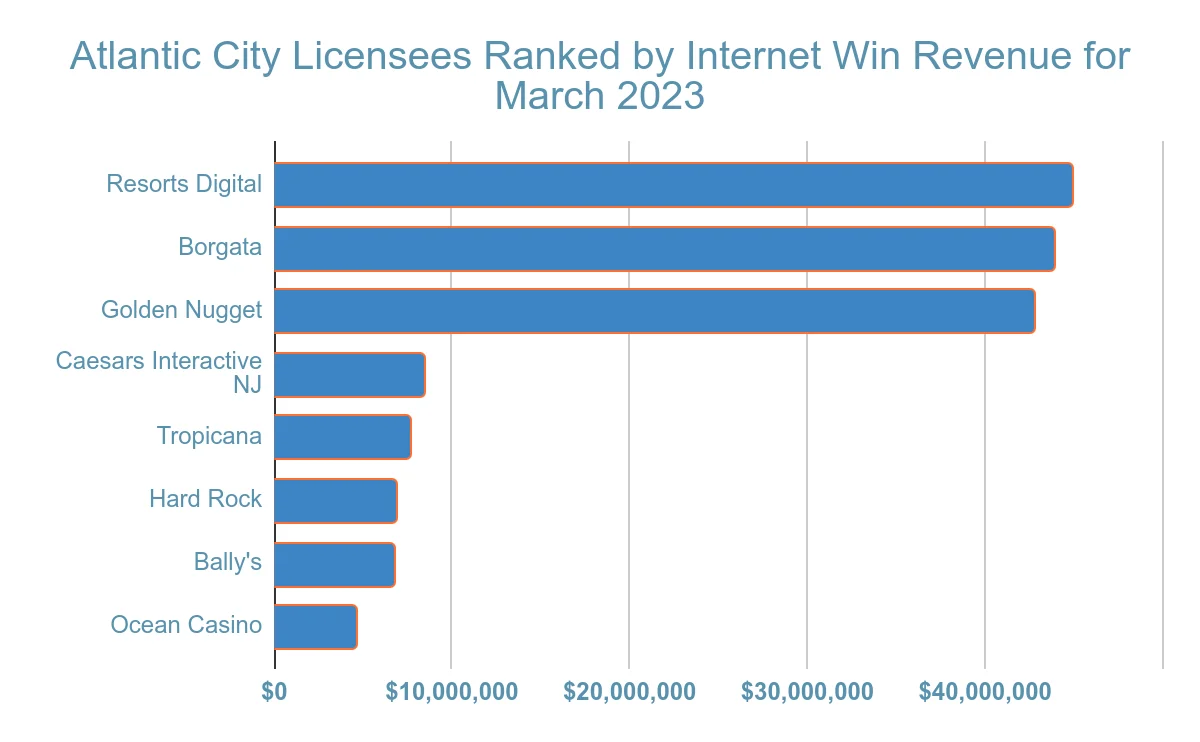
| Atlantic City Internet Win Revenue March 2023 | |||
|---|---|---|---|
| Casino Licensees | 2023 | 2022 | Change % |
| Bally’s | $6,742,392.00 | $1,799,769.00 | 274.6 |
| Borgata | $43,912,679.00 | $41,362,030.00 | 6.2 |
| Caesars Interactive NJ | $8,427,026.00 | $9,933,592.00 | -15.2 |
| Golden Nugget/ Golden Nugget Online Gaming | $42,709,332.00 | $38,280,684.00 | 11.6 |
| Hard Rock | $6,832,131.00 | $5,719,362.00 | 19.5 |
| Ocean Casino | $4,605,260.00 | $2,349,866.00 | 96 |
| Resorts Digital | $44,867,111.00 | $30,844,754.00 | 45.5 |
| Tropicana | $7,615,894.00 | $10,364,996.00 | -26.5 |
| Total: | $165,711,825.00 | $140,655,053.00 | 17.8 |
- Resorts Digital, recording online casino revenue of $44.9 million
- Borgata with internet wins of $43.9 million
- Golden Nugget with internet wins of $42.7 million
| Atlantic City Total Gaming Revenue March 2023 | |||
|---|---|---|---|
| Licensee | 2023 | 2022 | Change % |
| Bally’s | $17,354,191.00 | $15,321,974.00 | 13.3 |
| Borgata | $113,568,252.00 | $106,935,960.00 | 6.2 |
| Caesars | $17,021,943.00 | $18,904,283.00 | -10 |
| Caesars Interactive NJ | $8,427,026.00 | $9,933,592.00 | -15.2 |
| Golden Nugget | $55,079,866.00 | $51,119,747.00 | 7.7 |
| Hard Rock | $49,778,668.00 | $45,926,282.00 | 8.4 |
| Harrah’s | $20,599,462.00 | $20,192,079.00 | 2 |
| Ocean Casino | $39,583,378.00 | $27,936,320.00 | 41.7 |
| Resorts | $12,578,859.00 | $13,019,465.00 | -3.4 |
| Resorts Digital (online-only) | $74,660,088.00 | $42,591,228.00 | 75.3 |
| Tropicana | $32,369,545.00 | $31,012,415.00 | 4.4 |
| Racetracks | 46378275 | 40777024 | 13.7 |
| Total: | $487,399,553.00 | $423,670,369.00 | 15 |
- Borgata with total gaming revenue of $113.6 million
- Resorts Digital, which reported March total gaming revenue of $74.7 million
- Golden Nugget with total gaming revenue of $55.1 million
April Gaming Revenue in Atlantic City
The month of April brought the casinos, racetracks, and their partners operating in Atlantic City total gaming revenue of $462.7 million, a 9.5% jump from the $422.5 million generated in April 2022. The year-to-date numbers for April showed total gaming revenue of $1.80 billion, reflecting 12.4% growth compared with $1.60 billion in the prior period.
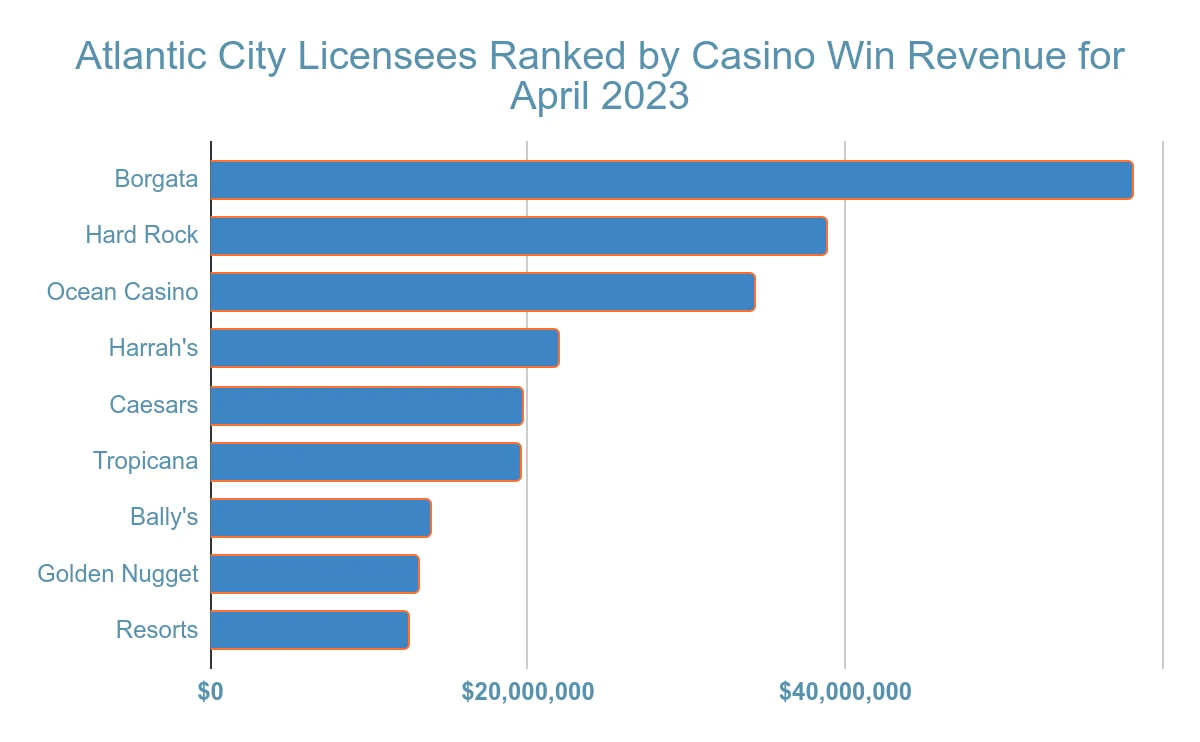
The total gaming revenue generated by casino and sports wagering licensees in Atlantic City in April comprised casino wins of $231.5 million, internet wins of $158.9 million, and sports wagering revenue of $72.3 million.
| April 2023 Casino Win Revenue | |||
|---|---|---|---|
| Casino Licensee | 2023 | 2022 | Change % |
| Bally’s | $13,793,997.00 | $14,418,816.00 | -4.3 |
| Borgata | $58,104,927.00 | $61,603,848.00 | -5.7 |
| Caesars | $19,645,197.00 | $20,196,227.00 | -2.7 |
| Golden Nugget | $13,127,944.00 | $12,312,101.00 | 6.6 |
| Hard Rock | $38,802,074.00 | $40,590,812.00 | -4.4 |
| Harrah’s | $21,852,768.00 | $23,172,402.00 | -5.7 |
| Ocean Casino | $34,201,710.00 | $26,242,071.00 | 30.3 |
| Resorts | $12,444,380.00 | $14,326,250.00 | -13.1 |
| Tropicana | $19,501,379.00 | $22,428,058.00 | -13 |
| Total: | $231,474,376.00 | $235,290,585.00 | -1.6 |
- Borgata with $58.1 million in casino wins for April 2023
- Hard Rock with $38.8 million from casino operations
- Ocean Casino with casino wins of $34.2 million
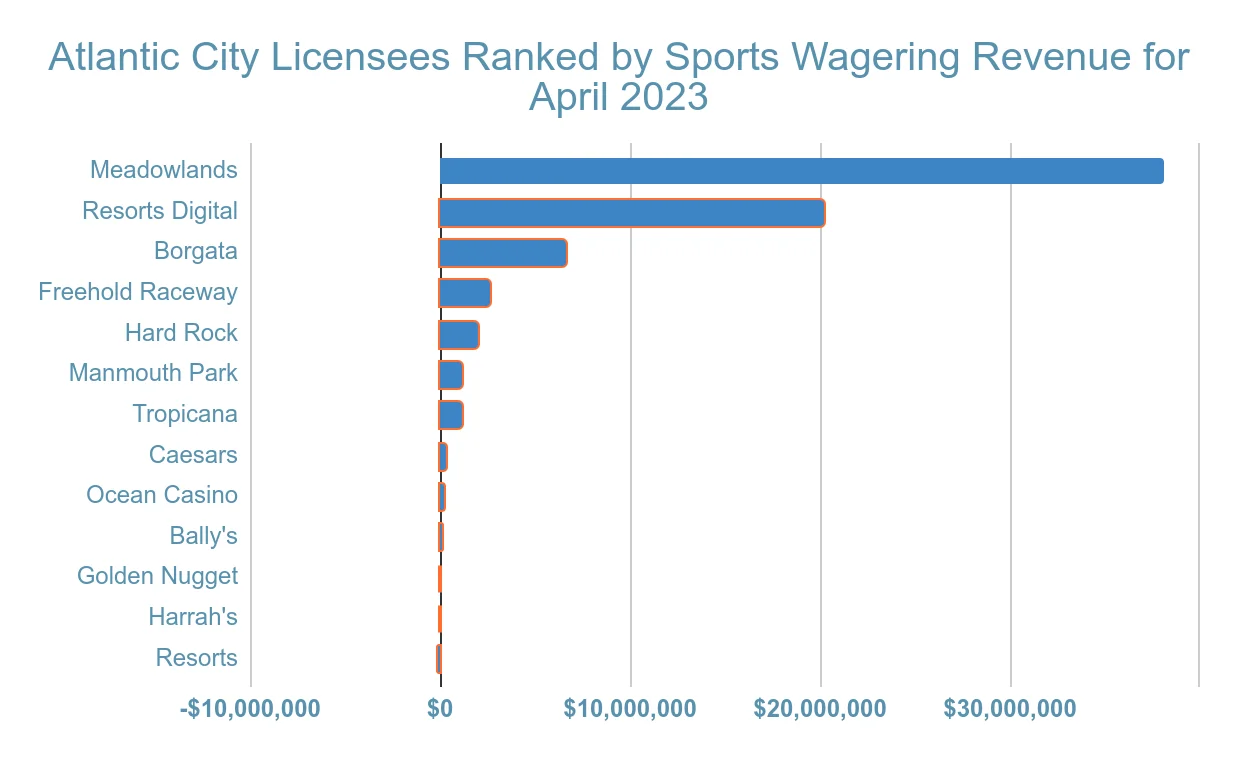
| April 2023 Sports Wagering Revenue | |||
|---|---|---|---|
| Licensee | 2023 | 2022 | Change % |
| Bally’s | $88,135.00 | $40,861.00 | 115.7 |
| Borgata | $6,578,161.00 | $4,516,007.00 | 45.7 |
| Caesars | $307,667.00 | $85,065.00 | 261.7 |
| Golden Nugget | $16,308.00 | -$241,554.00 | 106.8 |
| Hard Rock | $2,044,169.00 | $1,457,748.00 | 40.2 |
| Harrah’s | -$48,949.00 | -$22,499.00 | -117.6 |
| Ocean Casino | $207,328.00 | -$45,529.00 | 555.4 |
| Resorts | -$58,339.00 | -$156,140.00 | 62.6 |
| Resorts Digital (online-only) | $20,246,080.00 | $7,446,673.00 | 171.9 |
| Tropicana | $1,132,639.00 | $1,502,646.00 | -24.6 |
| Racetracks | $41,790,837.00 | $35,762,530.00 | 16.9 |
| Total: | $72,304,036.00 | $50,345,808.00 | 43.6 |
- Meadowlands with sports wagering revenue of $38.0 million
- Resorts Digital with sports wagering revenue of $20.4 million
- Borgata recording sports wagering revenue of $6.6 million for April 2023
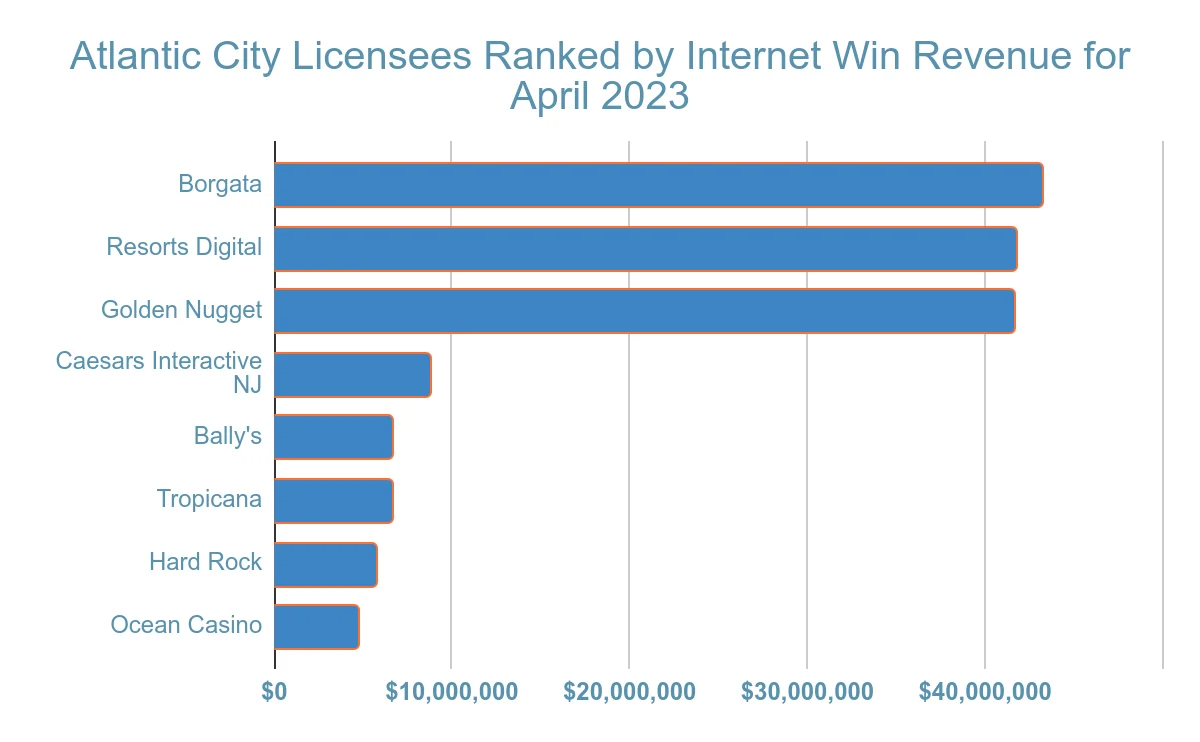
| Atlantic City Internet Win Revenue April 2023 | |||
|---|---|---|---|
| Casino Licensees | 2023 | 2022 | Change % |
| Bally’s | $6,678,622.00 | $2,967,824.00 | 125 |
| Borgata | $43,180,552.00 | $39,928,794.00 | 8.1 |
| Caesars Interactive NJ | $8,726,139.00 | $9,086,897.00 | -4 |
| Golden Nugget/ Golden Nugget Online Gaming | $41,652,196.00 | $38,142,387.00 | 9.2 |
| Hard Rock | $5,712,960.00 | $6,530,176.00 | -12.5 |
| Ocean Casino | $4,719,115.00 | $1,677,837.00 | 181.3 |
| Resorts Digital | $41,696,819.00 | $29,136,201.00 | 43.1 |
| Tropicana | $6,570,588.00 | $9,413,282.00 | -30.2 |
| Total: | $158,936,991.00 | $136,883,398.00 | 16.1 |
- Borgata with $43.2 million in online casino revenue
- Resorts Digital with online casino wins of $41.7 million
- Golden Nugget with internet wins of about $41.7 million, with Resorts Digital edging Golden Nugget by a slim margin
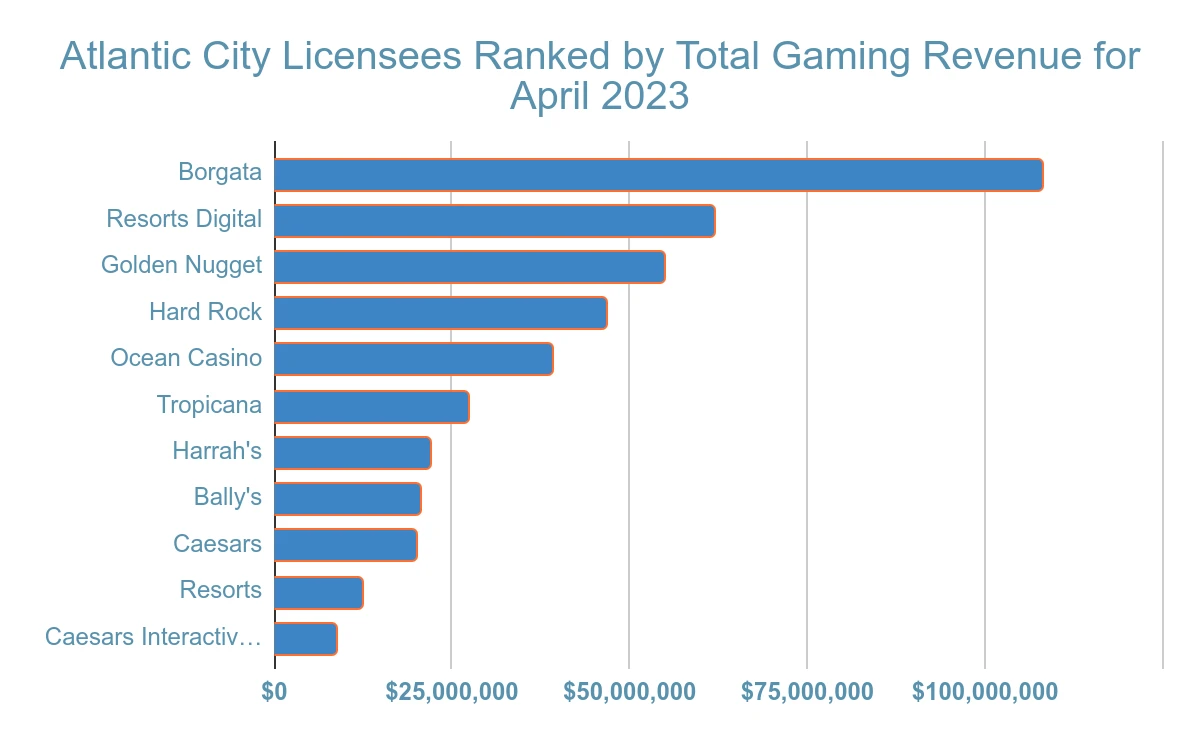
| Atlantic City Total Gaming Revenue April 2023 | |||
|---|---|---|---|
| Licensee | 2023 | 2022 | Change % |
| Bally’s | $20,560,754.00 | $17,427,501.00 | 18 |
| Borgata | $107,863,640.00 | $106,048,649.00 | 1.7 |
| Caesars | $19,952,864.00 | $20,281,292.00 | -1.6 |
| Caesars Interactive NJ | $8,726,139.00 | $9,086,897.00 | -4 |
| Golden Nugget | $54,796,448.00 | $50,212,934.00 | 9.1 |
| Hard Rock | $46,559,203.00 | $48,578,736.00 | -4.2 |
| Harrah’s | $21,803,819.00 | $23,149,903.00 | -5.8 |
| Ocean Casino | $39,128,153.00 | $27,874,379.00 | 40.4 |
| Resorts | $12,386,041.00 | $14,170,110.00 | -12.6 |
| Resorts Digital (online-only) | $61,942,899.00 | $36,582,874.00 | 69.3 |
| Tropicana | $27,204,606.00 | $33,343,986.00 | -18.4 |
| Racetracks | $41,790,837.00 | $35,762,530.00 | 16.9 |
| Total: | $462,715,403.00 | $422,519,791.00 | 9.5 |
- Borgata, which reported total gaming revenue for April 2023 of $107.9 million
- Resorts Digital with total gaming revenue of $61.9 million
- Golden Nugget with total gaming revenue of $54.8 million
May Gaming Revenue in Atlantic City
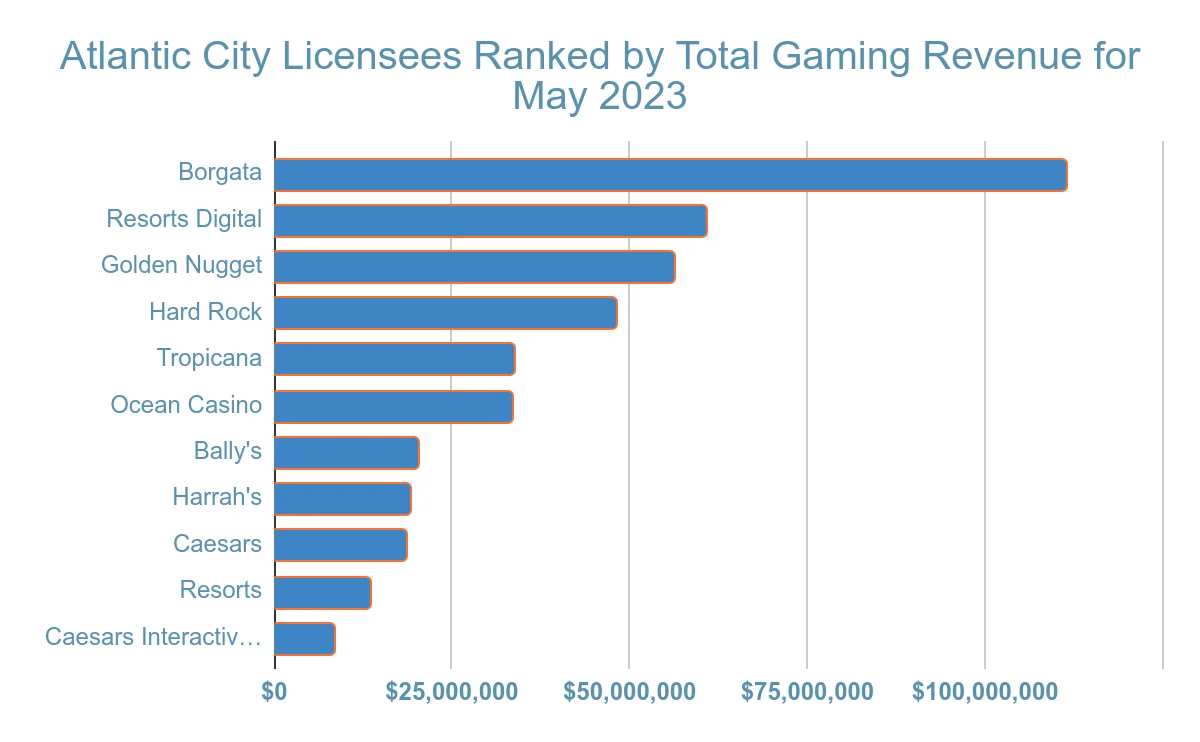
Atlantic City’s casino and racetrack sector reported May 2023 total gaming revenue of $470.9 million, representing a 9.4% jump from the $430.6 million generated in May 2022. Year-to-date gaming revenue reached $2.27 billion, an 11.7% increase over the $2.03 billion posted through May 2022.
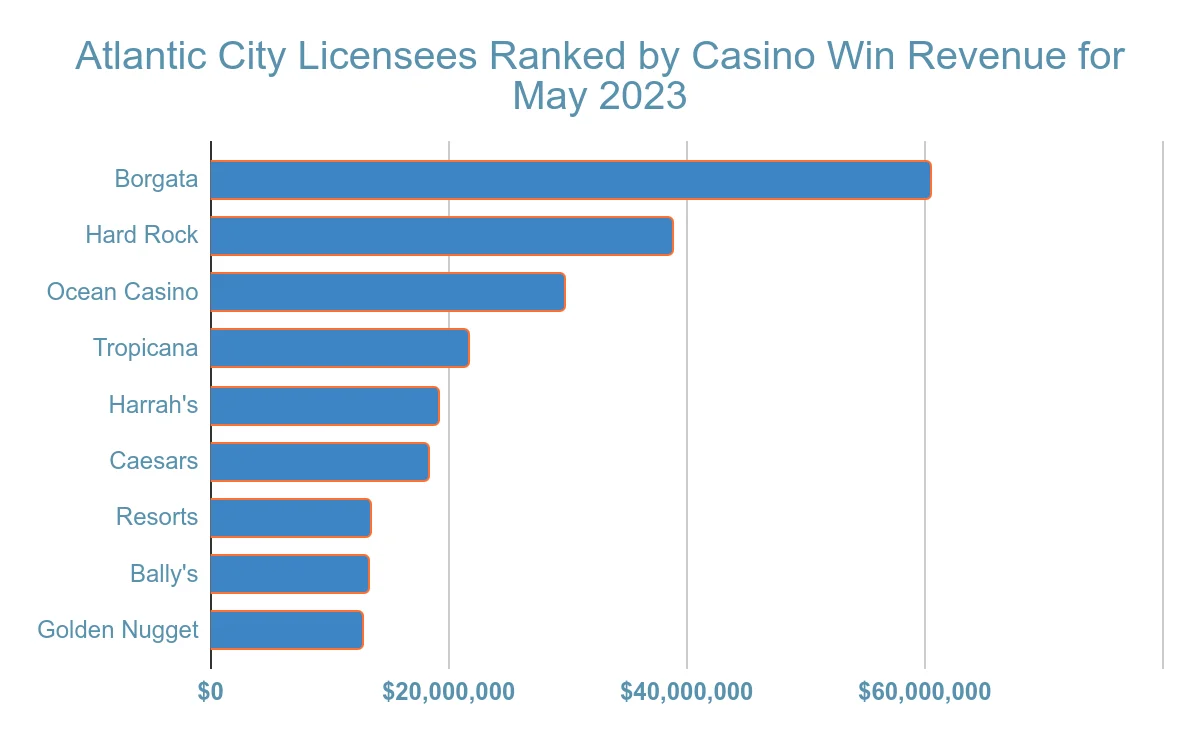
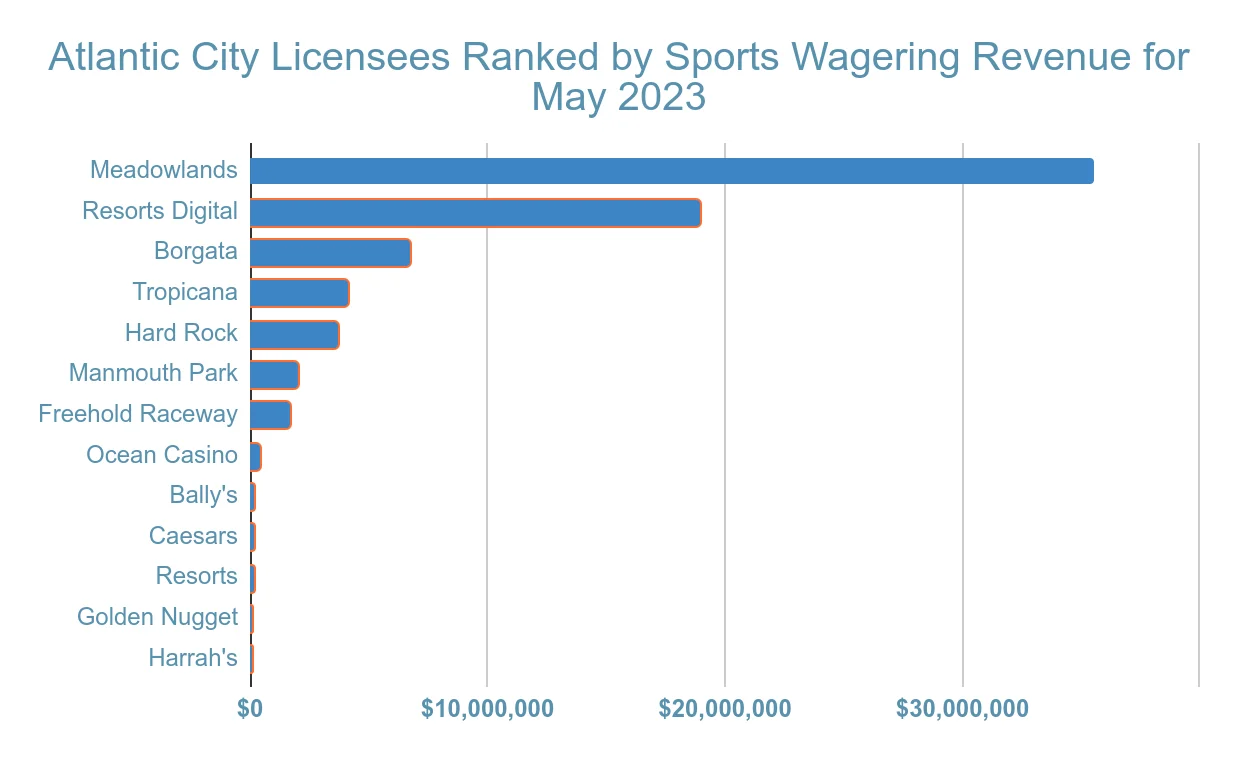
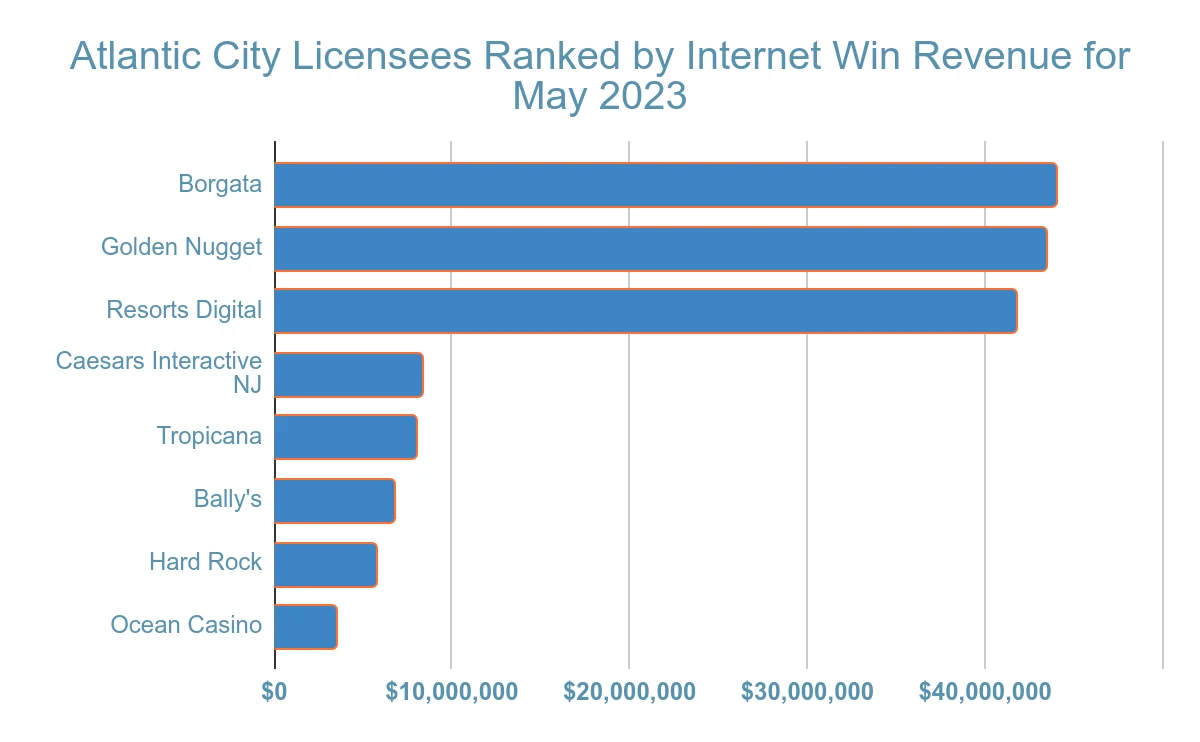
The total gaming revenue for the Jersey Shore region can be divided into three parts: casino wins of $227.3 million, sports wagering revenue of $82.2 million, and online casino wins of $161.4 million.
| May 2023 Casino Win Revenue | |||
|---|---|---|---|
| Casino Licensee | 2023 | 2022 | Change % |
| Bally’s | $13,197,719.00 | $12,670,693.00 | 4.2 |
| Borgata | $60,516,428.00 | $63,368,577.00 | -4.5 |
| Caesars | $18,327,523.00 | $20,282,273.00 | -9.6 |
| Golden Nugget | $12,657,711.00 | $12,790,607.00 | -1 |
| Hard Rock | $38,786,821.00 | $41,501,487.00 | -6.5 |
| Harrah’s | $19,047,194.00 | $21,243,212.00 | -10.3 |
| Ocean Casino | $29,750,487.00 | $25,355,697.00 | 17.3 |
| Resorts | $13,447,195.00 | $14,147,608.00 | -5 |
| Tropicana | $21,615,608.00 | $21,663,462.00 | -0.2 |
| Total: | $227,346,686.00 | $233,023,616.00 | -2.4 |
- Borgata with casino revenue of $60.5 million for May 2023
- Hard Rock with casino wins of $38.8 million generated in May 2023
- Ocean Casino with $29.8 million in casino wins for May 2023
| May 2023 Sports Wagering Revenue | |||
|---|---|---|---|
| Licensee | 2023 | 2022 | Change % |
| Bally’s | $188,117.00 | $806,569.00 | -76.7 |
| Borgata | $6,750,041.00 | $6,446,540.00 | 4.7 |
| Caesars | $159,806.00 | $134,886.00 | 18.5 |
| Golden Nugget | $119,517.00 | $208,281.00 | -42.6 |
| Hard Rock | $3,674,063.00 | $1,355,962.00 | 171 |
| Harrah’s | $70,513.00 | $77,412.00 | -8.9 |
| Ocean Casino | $400,326.00 | $131,296.00 | 204.9 |
| Resorts | $156,172.00 | -$201,236.00 | -177.6 |
| Resorts Digital (online-only) | $18,970,553.00 | $11,285,951.00 | 68.1 |
| Tropicana | $4,164,721.00 | $1,214,122.00 | 243 |
| Racetracks | $47,511,575.00 | $40,134,253.00 | 18.4 |
| Total: | $82,165,404.00 | $61,594,036.00 | 33.4 |
- Meadowlands, which reported sports wagering revenue of $35.5 million for May 2023
- Resorts Digital with total sports wagering revenue of almost $19 million
- Borgata, reporting sports wagering revenue of $6.8 million for May 2023
| Atlantic City Internet Win Revenue May 2023 | |||
|---|---|---|---|
| Casino Licensees | 2023 | 2022 | Change % |
| Bally’s | $6,767,140.00 | $3,357,262.00 | 101.6 |
| Borgata | $44,012,713.00 | $42,587,342.00 | 3.3 |
| Caesars Interactive NJ | $8,311,892.00 | $9,660,690.00 | -14 |
| Golden Nugget/ Golden Nugget Online Gaming | $43,467,840.00 | $34,603,763.00 | 25.6 |
| Hard Rock | $5,725,676.00 | $5,781,870.00 | -1 |
| Ocean Casino | $3,428,650.00 | $2,199,468.00 | 55.9 |
| Resorts Digital | $41,680,670.00 | $29,790,063.00 | 39.9 |
| Tropicana | $8,017,343.00 | $8,036,004.00 | -0.2 |
| Total: | $161,411,924.00 | $136,016,462.00 | 18.7 |
- Borgata with online casino revenue of $44.0 million
- Golden Nugget with total Internet win revenue of $43.5 million
- Resorts Digital with online casino wins of $41.7 million
| Atlantic City Total Gaming Revenue May 2023 | |||
|---|---|---|---|
| Licensee | 2023 | 2022 | Change % |
| Bally’s | $20,152,976.00 | $16,834,524.00 | 19.7 |
| Borgata | $111,279,182.00 | $112,402,459.00 | -1 |
| Caesars | $18,487,329.00 | $20,417,139.00 | -9.5 |
| Caesars Interactive NJ | $8,311,892.00 | $9,660,690.00 | -14 |
| Golden Nugget | $56,245,068.00 | $47,602,651.00 | 18.2 |
| Hard Rock | $48,186,560.00 | $48,639,319.00 | -0.9 |
| Harrah’s | $19,117,707.00 | $21,320,624.00 | -10.3 |
| Ocean Casino | $33,579,463.00 | $27,686,461.00 | 21.3 |
| Resorts | $13,603,367.00 | $13,946,327.00 | -2.5 |
| Resorts Digital (online-only) | $60,651,223.00 | $41,076,014.00 | 47.7 |
| Tropicana | $33,797,672.00 | $30,913,588.00 | 9.3 |
| Racetracks | $47,511,575.00 | $40,134,253.00 | 18.4 |
| Total: | $470,924,014.00 | $430,634,049.00 | 9.4 |
- For May, Borgata generated total gaming revenue of $111.3 million
- Resorts Digital reported May 2023 total gaming revenue of $60.7 million
- Golden Nugget ranked third with total gaming revenue of $56.2 million for May 2023
June Gaming Revenue in Atlantic City
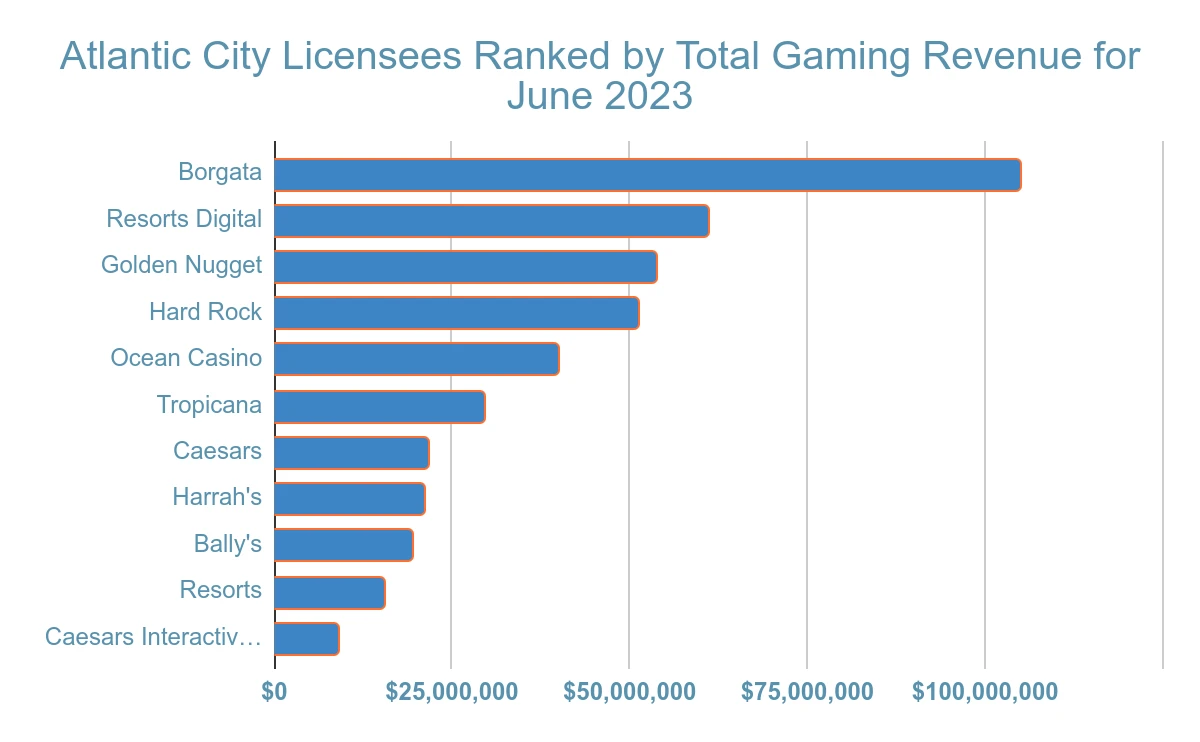
For June 2023, Atlantic City’s casinos, racetracks, and their partners reported total gaming revenue of $457.2 million, indicating a 13.9% increase compared with $401.5 million in June 2022. Year-to-date gaming revenue reached $2.72 billion, up 12.1% from $2.43 billion for the same period the previous year.
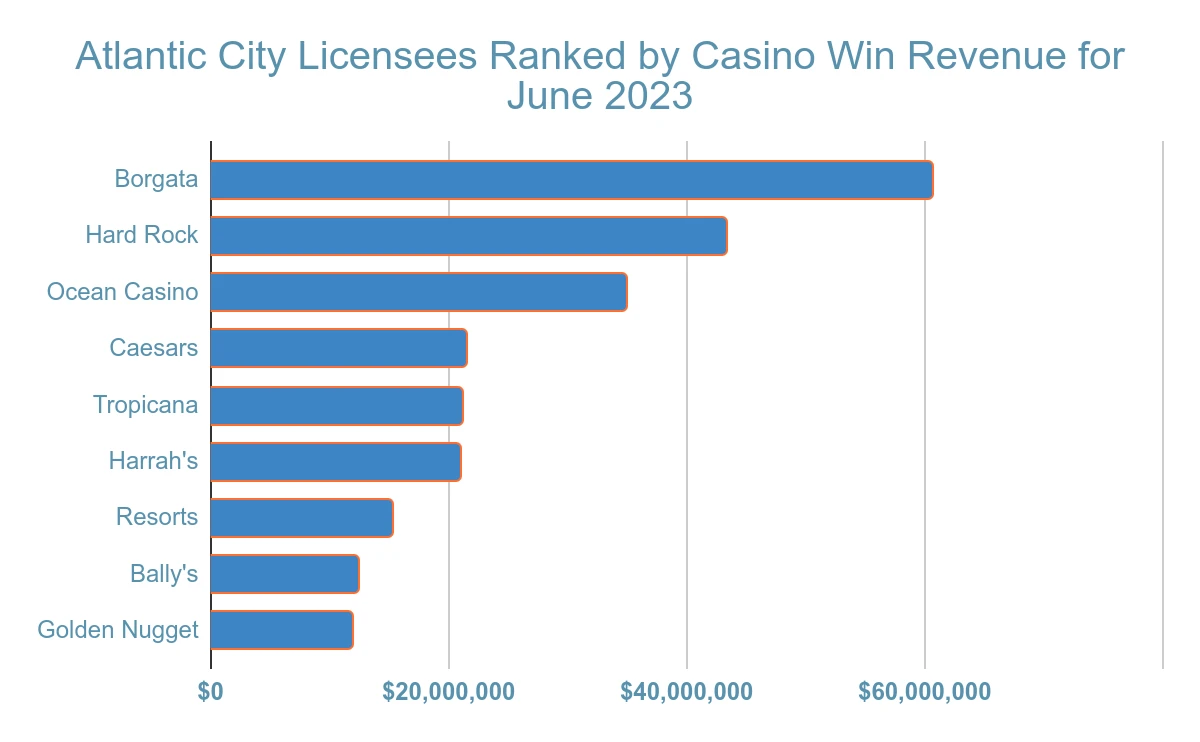
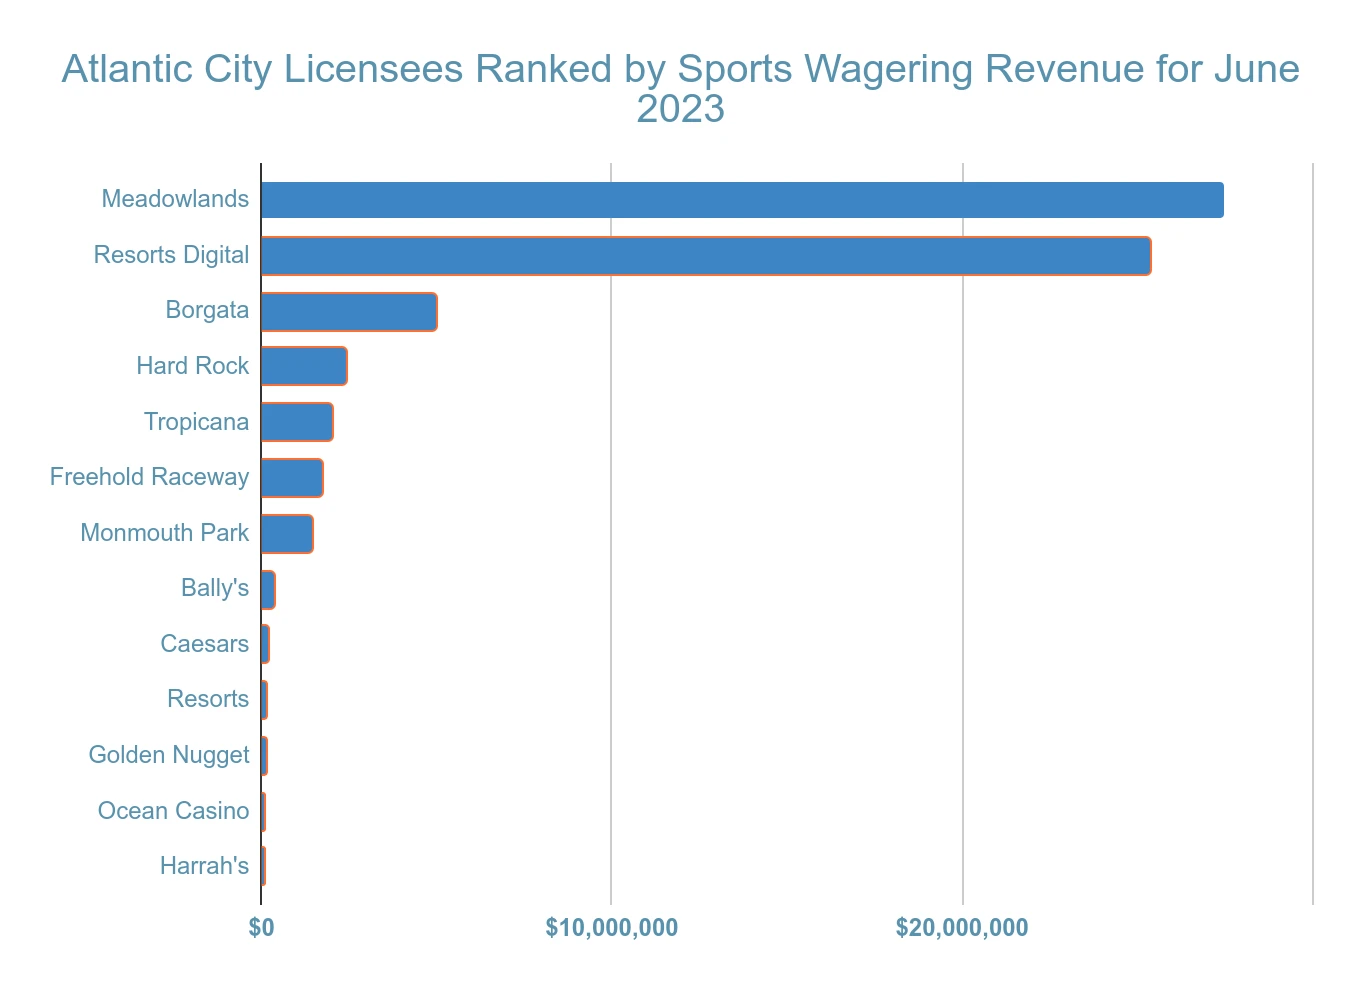
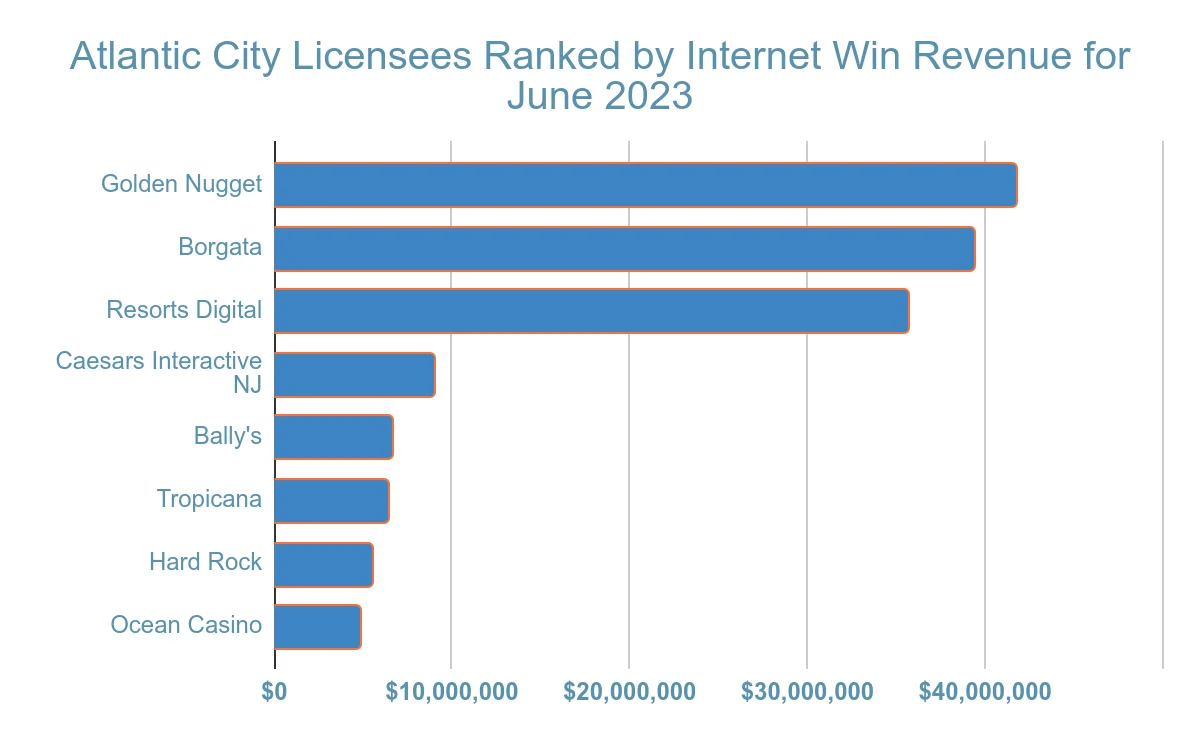
The total gaming revenue in the Jersey Shore region for June consisted of casino wins of $241.6 million, sports betting revenue of $66.4 million, and online casino revenue of $149.3 million.
| June 2023 Casino Win Revenue | |||
|---|---|---|---|
| Casino Licensee | 2023 | 2022 | Change % |
| Bally’s | $12,431,571.00 | $13,547,480.00 | -8.2 |
| Borgata | $60,526,413.00 | $54,253,745.00 | 11.6 |
| Caesars | $21,420,187.00 | $19,225,515.00 | 11.4 |
| Golden Nugget | $11,820,260.00 | $12,571,371.00 | -6 |
| Hard Rock | $43,297,613.00 | $44,557,577.00 | -2.8 |
| Harrah’s | $20,915,117.00 | $20,145,201.00 | 3.8 |
| Ocean Casino | $34,884,255.00 | $29,670,414.00 | 17.6 |
| Resorts | $15,207,061.00 | $13,715,558.00 | 10.9 |
| Tropicana | $21,058,140.00 | $21,455,987.00 | -1.9 |
| Total: | $241,560,617.00 | $229,142,848.00 | 5.4 |
- Borgata, with casino wins of $60.5 million for June 2023
- Hard Rock with casino win revenue of $43.3 million for June 2023
- Ocean Casino, which reported June casino revenue of $34.9 million
| June 2023 Sports Wagering Revenue | |||
|---|---|---|---|
| Licensee | 2023 | 2022 | Change % |
| Bally’s | $351,366.00 | $32,465.00 | 982.3 |
| Borgata | $4,953,679.00 | $4,803,284.00 | 3.1 |
| Caesars | $175,889.00 | $413,526.00 | -57.5 |
| Golden Nugget | $146,662.00 | $118,888.00 | 23.4 |
| Hard Rock | $2,416,516.00 | $1,560,278.00 | 54.9 |
| Harrah’s | $73,549.00 | $152,922.00 | -51.9 |
| Ocean Casino | $82,616.00 | $156,898.00 | -47.3 |
| Resorts | $150,304.00 | $132,516.00 | 13.4 |
| Resorts Digital (online-only) | $25,337,304.00 | $4,608,114.00 | 449.8 |
| Tropicana | $2,010,715.00 | $3,204,879.00 | -37.3 |
| Racetracks | $30,658,238.00 | $24,061,443.00 | 27.4 |
| Total: | $66,356,838.00 | $39,245,213.00 | 69.1 |
- Meadowlands with sports wagering revenue of $27.5 million for June 2023
- Resorts Digital with sports wagering revenue of $25.3 million
- Borgata with sports betting revenue of nearly $5 million
| Atlantic City Internet Win Revenue June 2023 | |||
|---|---|---|---|
| Casino Licensees | 2023 | 2022 | Change % |
| Bally’s | $6,631,811.00 | $4,076,804.00 | 62.7 |
| Borgata | $39,419,707.00 | $40,542,945.00 | -2.8 |
| Caesars Interactive NJ | $9,036,673.00 | $9,376,577.00 | -3.6 |
| Golden Nugget/ Golden Nugget Online Gaming | $41,766,499.00 | $35,705,464.00 | 17 |
| Hard Rock | $5,524,606.00 | $6,014,254.00 | -8.1 |
| Ocean Casino | $4,847,027.00 | $2,351,737.00 | 106.1 |
| Resorts Digital | $35,624,339.00 | $28,086,670.00 | 26.8 |
| Tropicana | $6,441,942.00 | $6,984,352.00 | -7.8 |
| Total: | $149,292,604.00 | $133,138,803.00 | 12.1 |
- Golden Nugget with online casino revenue of $41.8 million
- Borgata with Internet win revenue of $39.4 million
- Resorts Digital with $35.6 million in online casino revenue for June 2023
| Atlantic City Total Gaming Revenue June 2023 | |||
|---|---|---|---|
| Licensee | 2023 | 2022 | Change % |
| Bally’s | $19,414,748.00 | $17,656,749.00 | 10 |
| Borgata | $104,899,799.00 | $99,599,974.00 | 5.3 |
| Caesars | $21,596,076.00 | $19,639,041.00 | 10 |
| Caesars Interactive NJ | $9,036,673.00 | $9,376,577.00 | -3.6 |
| Golden Nugget | $53,733,421.00 | $48,395,723.00 | 11 |
| Hard Rock | $51,238,735.00 | $52,132,109.00 | -1.7 |
| Harrah’s | $20,988,666.00 | $20,298,123.00 | 3.4 |
| Ocean Casino | $39,813,898.00 | $32,179,049.00 | 23.7 |
| Resorts | $15,357,365.00 | $13,848,074.00 | 10.9 |
| Resorts Digital (online-only) | $60,961,643.00 | $32,694,784.00 | 86.5 |
| Tropicana | $29,510,797.00 | $31,645,218.00 | -6.7 |
| Racetracks | $30,658,238.00 | $24,061,443.00 | 27.4 |
| Total: | $457,210,059.00 | $401,526,864.00 | 13.9 |
- Borgata with total gaming revenue of $104.9 million
- Resorts Digital with total gaming revenue of almost $61 million
- Golden Nugget with total gaming revenue of $53.7 million
July Gaming Revenue in Atlantic City
Atlantic City’s casinos, racetracks, and their partners reported total gaming revenue of $506.2 million for July 2023, a 5.3% increase over $480.7 million in July 2022. Year-to-date results show gaming revenue of $3.23 billion, reflecting 11.0% growth compared with $2.91 billion for the previous period.
The July gaming revenue breakdown includes casino wins of $290.0 million, sports betting revenue of $61.0 million, and online casino wins of $155.2 million.
| July 2023 Casino Win Revenue | |||
|---|---|---|---|
| Casino Licensee | 2023 | 2022 | Change % |
| Bally’s | $17,203,588.00 | $16,820,296.00 | 2.3 |
| Borgata | $78,550,351.00 | $76,729,791.00 | 2.4 |
| Caesars | $24,858,542.00 | $25,156,222.00 | -1.2 |
| Golden Nugget | $13,995,573.00 | $14,487,010.00 | -3.4 |
| Hard Rock | $53,059,268.00 | $52,890,471.00 | 0.3 |
| Harrah’s | $25,229,950.00 | $26,432,039.00 | -4.5 |
| Ocean Casino | $37,719,121.00 | $40,370,765.00 | -6.6 |
| Resorts | $15,214,118.00 | $18,141,341.00 | -16.1 |
| Tropicana | $24,146,255.00 | $27,962,688.00 | -13.6 |
| Total: | $289,976,766.00 | $298,990,623.00 | -3 |
- Borgata with casino wins of $78.6 million for July 2023
- Hard Rock with reported casino wins of $53.1 million
- Ocean Casino with casino revenue of $37.7 million

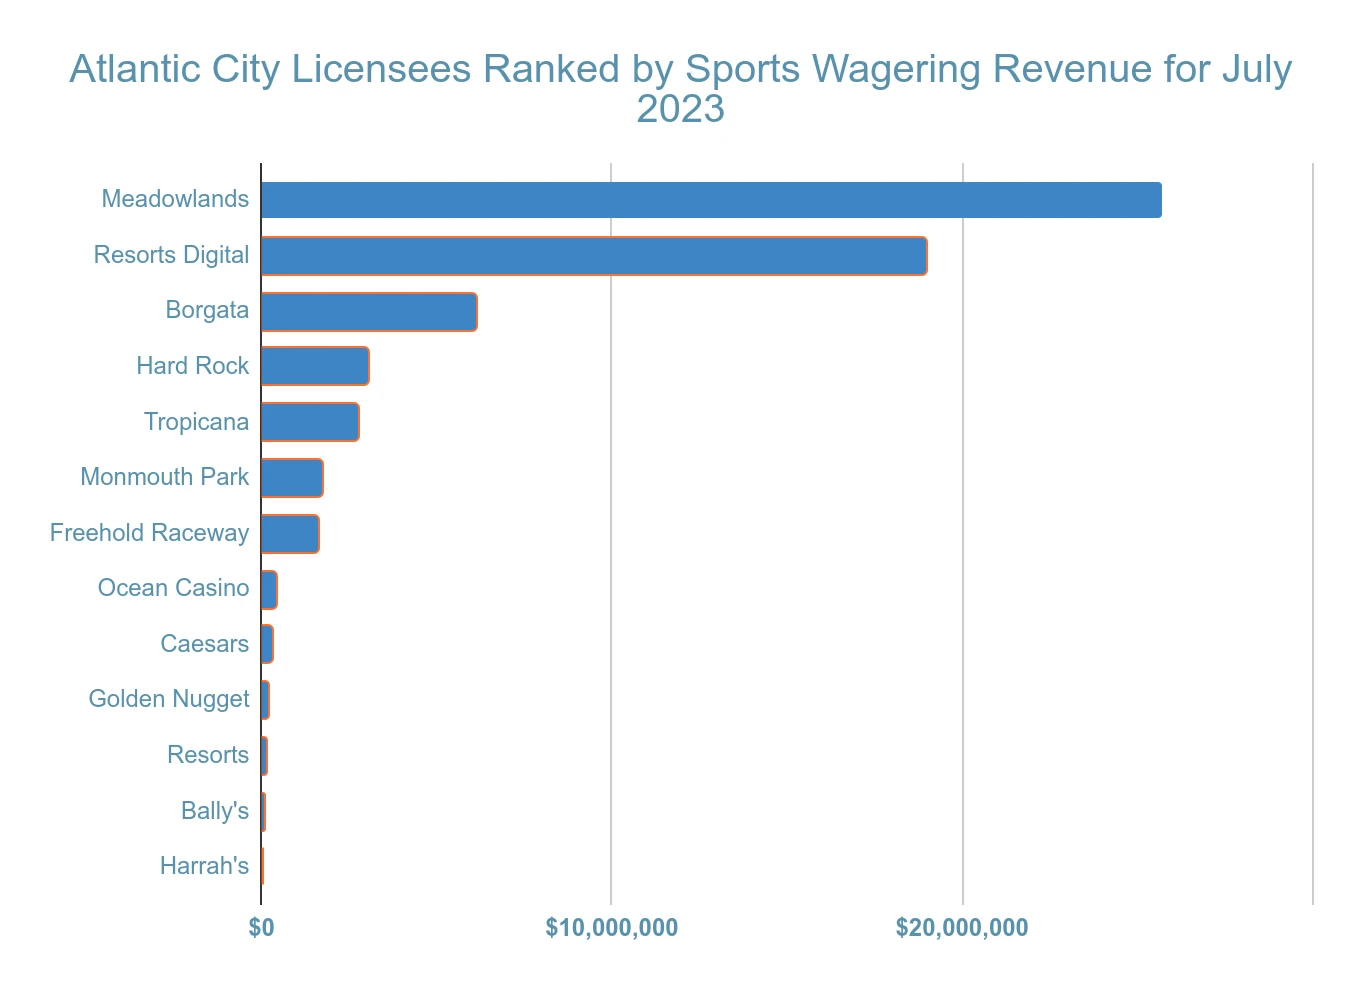
| July 2023 Sports Wagering Revenue | |||
|---|---|---|---|
| Licensee | 2023 | 2022 | Change % |
| Bally’s | $95,574.00 | -$48,654.00 | 296.4 |
| Borgata | $6,101,847.00 | $4,375,861.00 | 39.4 |
| Caesars | $300,868.00 | $381,329.00 | -21.1 |
| Golden Nugget | $196,286.00 | $135,188.00 | 45.2 |
| Hard Rock | $3,014,459.00 | $1,271,653.00 | 137.1 |
| Harrah’s | $38,720.00 | -$60,736.00 | 163.8 |
| Ocean Casino | $416,800.00 | $198,286.00 | 110.2 |
| Resorts | $133,670.00 | $173,593.00 | -23 |
| Resorts Digital (online-only) | $18,961,532.00 | $8,461,847.00 | 124.1 |
| Tropicana | $2,737,297.00 | $2,560,001.00 | 6.9 |
| Racetracks | $29,016,380.00 | $27,558,975.00 | 5.3 |
| Total: | $61,013,433.00 | $45,007,343.00 | 35.6 |
- Meadowlands, which generated sports betting revenue of $25.7 million in July 2023
- Resorts Digital with sports betting revenue of $19.0 million
- Borgata with sports betting revenue of $6.1 million for July 2023
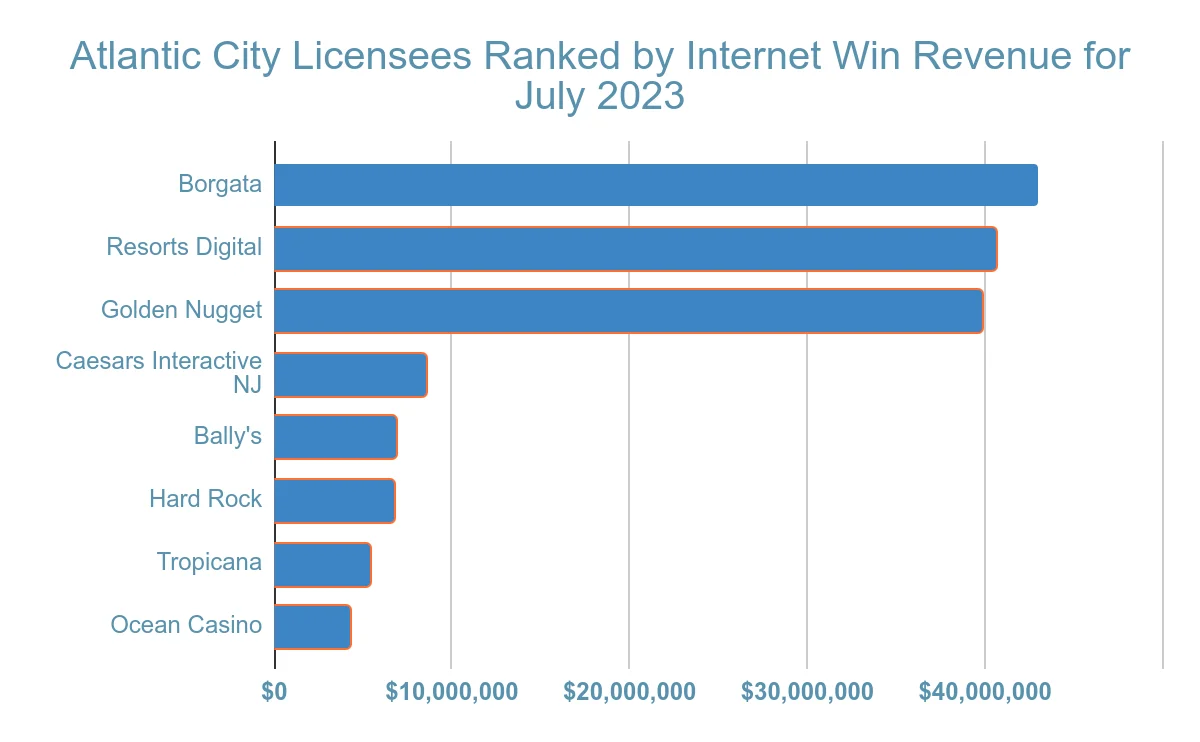
| Atlantic City Internet Win Revenue July 2023 | |||
|---|---|---|---|
| Casino Licensees | 2023 | 2022 | Change % |
| Bally’s | $6,829,889.00 | $4,013,463.00 | 70.2 |
| Borgata | $42,995,859.00 | $42,986,001.00 | 0 |
| Caesars Interactive NJ | $8,556,978.00 | $10,924,469.00 | -21.7 |
| Golden Nugget/ Golden Nugget Online Gaming | $39,787,349.00 | $34,529,509.00 | 15.2 |
| Hard Rock | $6,687,917.00 | $5,714,945.00 | 17 |
| Ocean Casino | $4,301,099.00 | $2,739,278.00 | 57 |
| Resorts Digital | $40,570,833.00 | $30,480,354.00 | 33.1 |
| Tropicana | $5,435,131.00 | $5,313,297.00 | 2.3 |
| Total: | $155,165,055.00 | $136,701,316.00 | 13.5 |
- Borgata with online casino revenue of $43.0 million
- Resorts Digital with $40.6 million in Internet wins
- Golden Nugget with Internet wins of $39.8 million
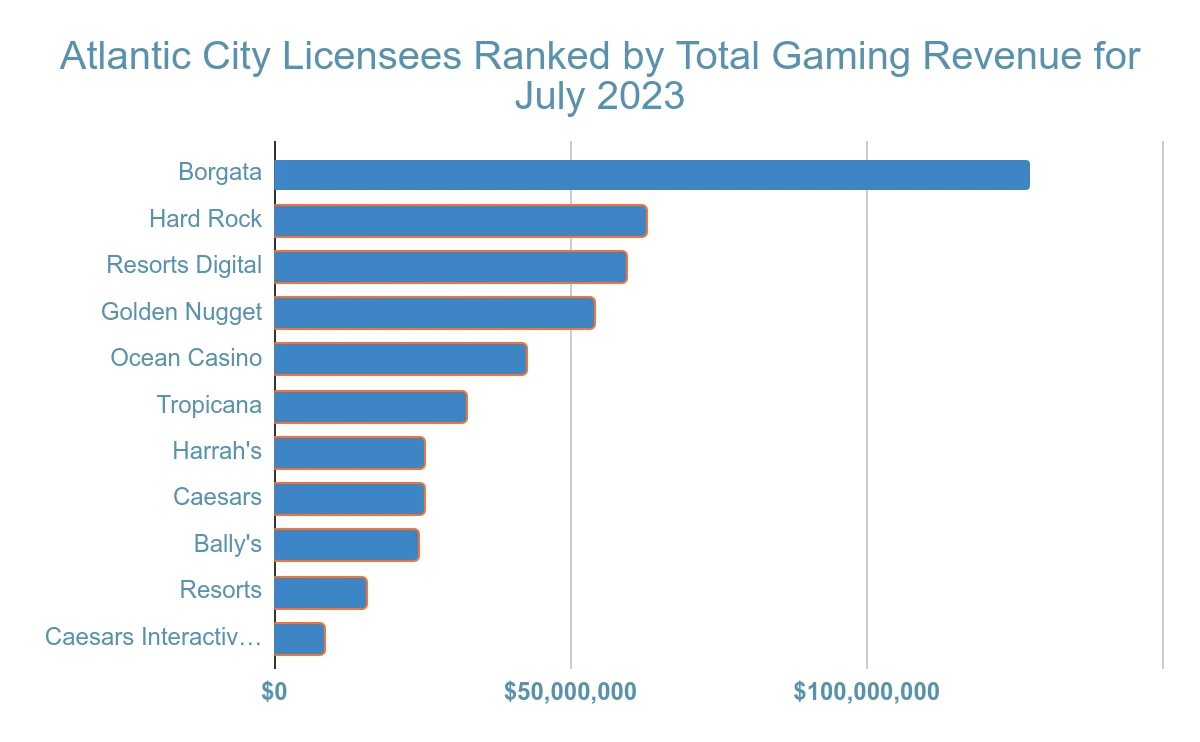
| Atlantic City Total Gaming Revenue August 2023 | |||
|---|---|---|---|
| Licensee | 2023 | 2022 | Change % |
| Bally’s | $23,303,040.00 | $20,191,577.00 | 15.4 |
| Borgata | $117,989,494.00 | $120,788,774.00 | -2.3 |
| Caesars | $22,036,553.00 | $22,170,427.00 | -0.6 |
| Caesars Interactive NJ | $6,614,107.00 | $8,900,003.00 | -25.7 |
| Golden Nugget | $54,075,808.00 | $44,515,165.00 | 21.5 |
| Hard Rock | $59,213,155.00 | $53,908,418.00 | 9.8 |
| Harrah’s | $24,497,890.00 | $25,123,499.00 | -2.5 |
| Ocean Casino | $44,624,505.00 | $39,940,054.00 | 11.7 |
| Resorts | $17,668,969.00 | $18,718,862.00 | -5.6 |
| Resorts Digital (online-only) | $99,217,987.00 | $43,532,669.00 | 127.9 |
| Tropicana | $33,026,512.00 | $35,101,324.00 | -5.9 |
| Racetracks | $29,333,199.00 | $37,795,659.00 | -22.4 |
| Total: | $531,601,219.00 | $470,686,431.00 | 12.9 |
- Borgata, which reported gaming revenue of $127.6 million for July 2023
- Hard Rock with total gaming revenue of $62.8 million for that month
- Resorts Digital with total gaming revenue of $59.5 million for July 2023
August Gaming Revenue in Atlantic City
Official reports for August 2023 show total gaming revenue of $531.6 million generated by all casinos, racetracks, and their partners in Atlantic City. The August report reflects a 12.9% increase compared with the $470.7 million recorded in August 2022.
Year-to-date figures through August 2023 show total gaming revenue of $3.77 billion, an 11.2% increase over the $3.38 billion generated during the previous period.
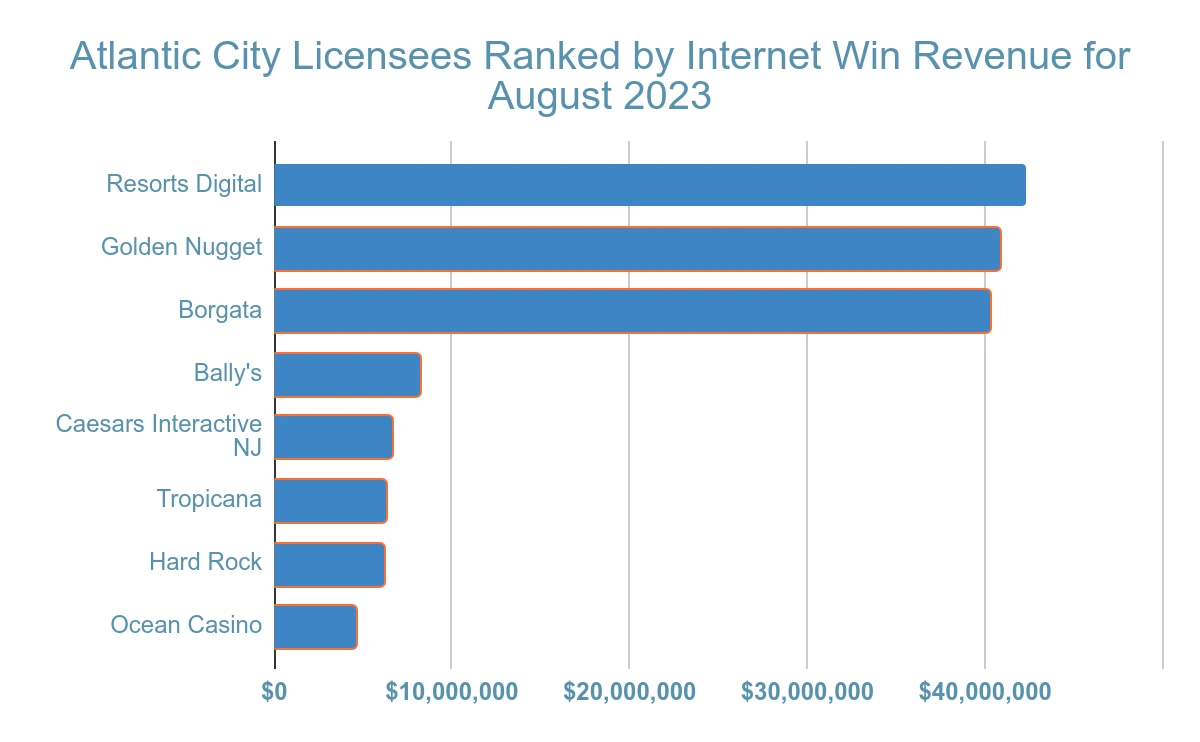
August revenue included in-person casino revenue of $280.3 million, sports betting revenue of $66.7 million, and Internet win of $155.3 million.
| August 2023 Casino Win Revenue | |||
|---|---|---|---|
| Casino Licensee | 2023 | 2022 | Change % |
| Bally’s | $15,009,194.00 | $15,735,889.00 | -4.6 |
| Borgata | $73,031,668.00 | $71,971,836.00 | 1.5 |
| Caesars | $22,001,286.00 | $21,654,534.00 | 1.6 |
| Golden Nugget | $13,153,776.00 | $12,940,692.00 | 1.6 |
| Hard Rock | $50,720,905.00 | $45,807,222.00 | 10.7 |
| Harrah’s | $24,532,895.00 | $24,993,072.00 | -1.8 |
| Ocean Casino | $39,528,347.00 | $36,559,185.00 | 8.1 |
| Resorts | $17,600,888.00 | $18,458,776.00 | -4.6 |
| Tropicana | $24,706,715.00 | $25,854,657.00 | -4.4 |
| Total: | $280,285,674.00 | $273,975,863.00 | 2.3 |
- Borgata with casino revenue of $73.0 million
- Hard Rock with casino revenue of $50.7 million
- Ocean Casino, which reported casino revenue of $39.5 million

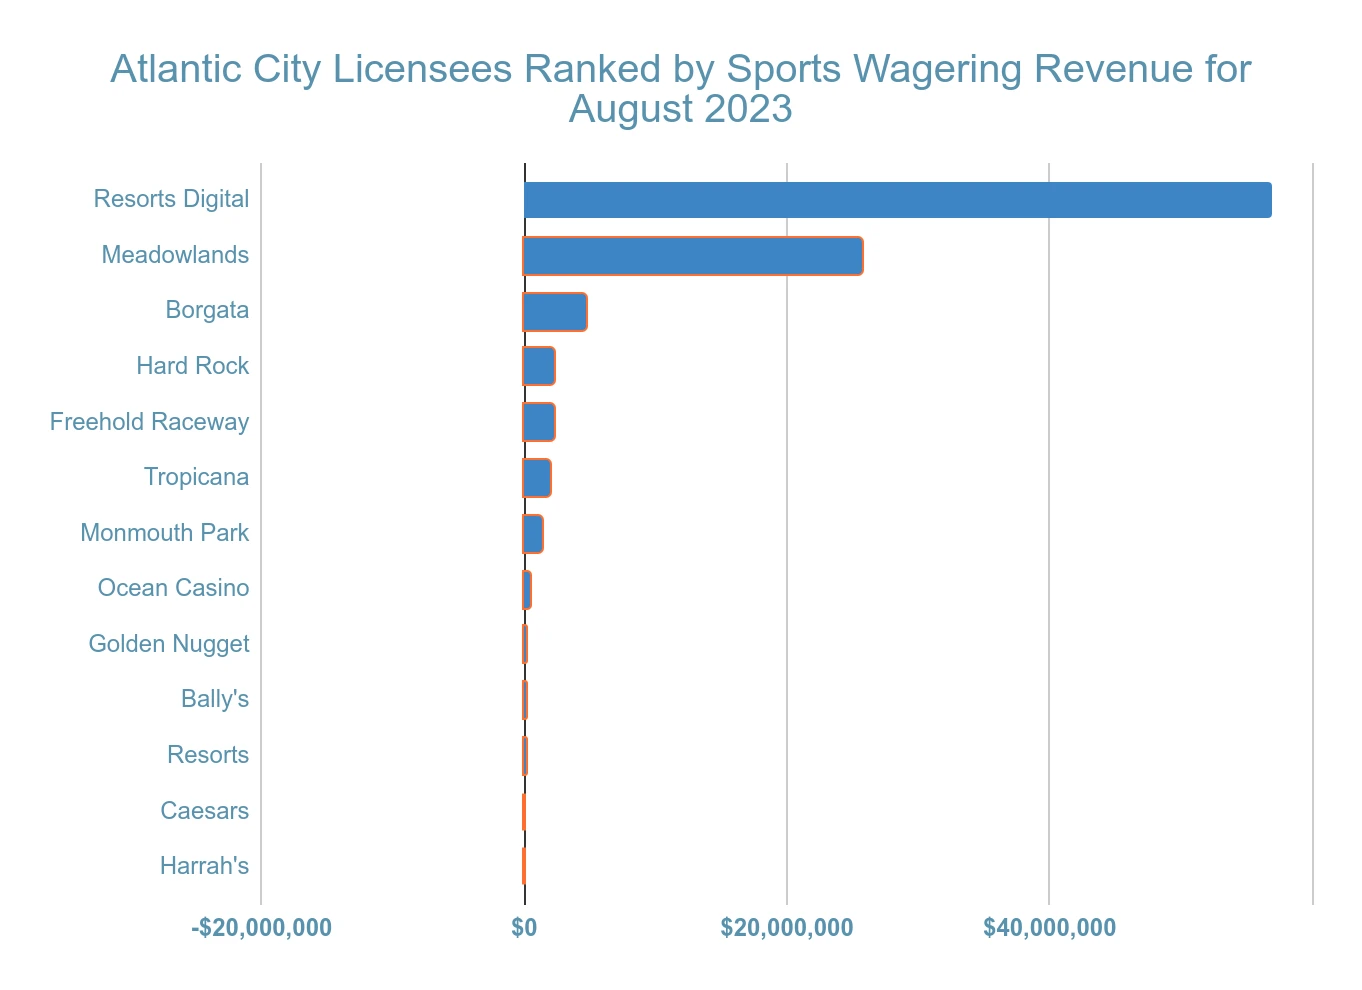
| August 2023 Sports Wagering Revenue | |||
|---|---|---|---|
| Licensee | 2023 | 2022 | Change % |
| Bally’s | $85,934.00 | -$72,099.00 | 219.2 |
| Borgata | $4,720,216.00 | $6,993,090.00 | -32.5 |
| Caesars | $35,267.00 | $515,893.00 | -93.2 |
| Golden Nugget | $116,690.00 | $197,568.00 | -40.9 |
| Hard Rock | $2,300,819.00 | $2,323,529.00 | -1 |
| Harrah’s | -$35,005.00 | $130,427.00 | -126.8 |
| Ocean Casino | $470,815.00 | $458,538.00 | 2.7 |
| Resorts | $68,081.00 | $260,086.00 | -73.8 |
| Resorts Digital (online-only) | $56,921,212.00 | $12,789,295.00 | 345.1 |
| Tropicana | $2,023,791.00 | $3,880,399.00 | -47.8 |
| Total: | $66,707,820.00 | $27,476,726.00 | 142.8 |
- In August 2023, Resorts Digital became the sportsbook with the highest sports betting revenue, totaling $56.9 million; for the 54 months prior to August 2023, Meadowlands had consistently held the top spot.
- Meadowlands was a strong contributor with sports wagering revenue of $25.7 million
- Borgata with reported sports betting revenue of $4.7 million
| Atlantic City Internet Win Revenue August 2023 | |||
|---|---|---|---|
| Casino Licensees | 2023 | 2022 | Change % |
| Bally’s | $8,207,912.00 | $4,527,787.00 | 81.3 |
| Borgata | $40,237,610.00 | $41,823,848.00 | -3.8 |
| Caesars Interactive NJ | $6,614,107.00 | $8,900,003.00 | -25.7 |
| Golden Nugget/ Golden Nugget Online Gaming | $40,805,342.00 | $31,376,905.00 | 30 |
| Hard Rock | $6,191,431.00 | $5,777,667.00 | 7.2 |
| Ocean Casino | $4,625,343.00 | $2,922,331.00 | 58.3 |
| Resorts Digital | $42,296,775.00 | $30,743,374.00 | 37.6 |
| Tropicana | $6,296,006.00 | $5,366,268.00 | 17.3 |
| Total: | $155,274,526.00 | $131,438,183.00 | 18.1 |
- Resorts Digital with Internet wins of $42.3 million
- Golden Nugget with online casino revenue of $40.8 million
- Borgata, which reported online gaming revenue of $40.2 million
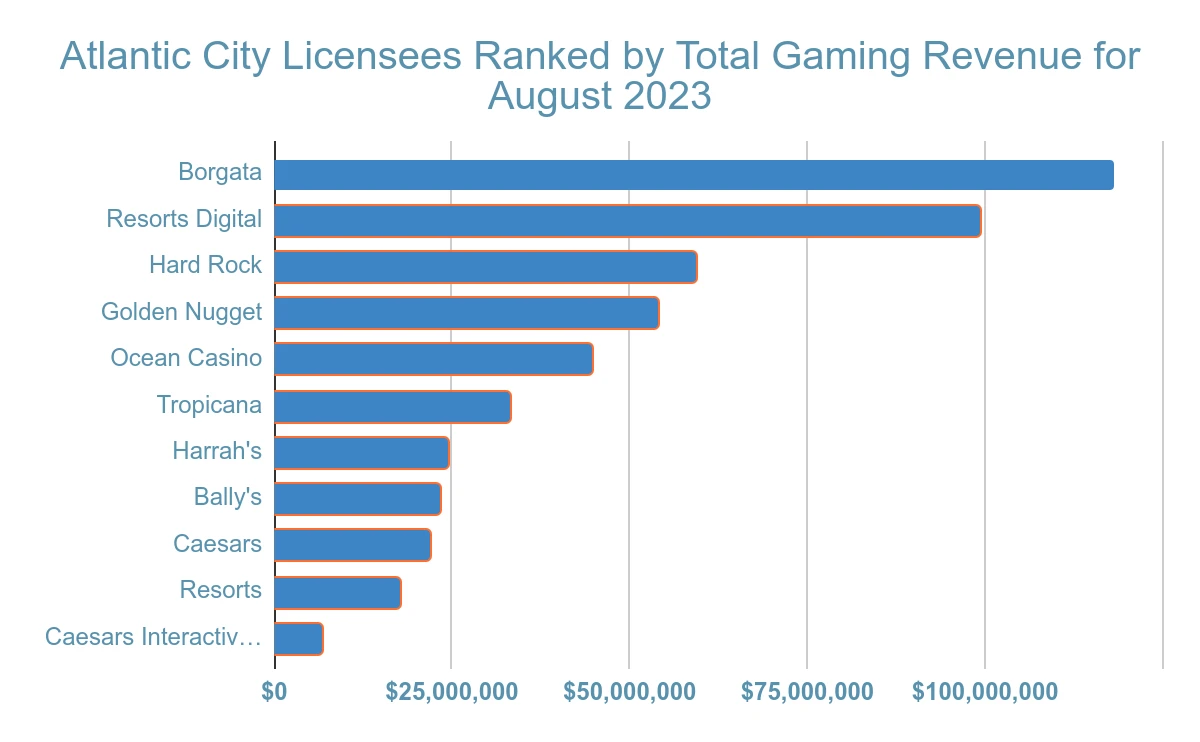
| Atlantic City Total Gaming Revenue August 2023 | |||
|---|---|---|---|
| Licensee | 2023 | 2022 | Change % |
| Bally’s | $23,303,040.00 | $20,191,577.00 | 15.4 |
| Borgata | $117,989,494.00 | $120,788,774.00 | -2.3 |
| Caesars | $22,036,553.00 | $22,170,427.00 | -0.6 |
| Caesars Interactive NJ | $6,614,107.00 | $8,900,003.00 | -25.7 |
| Golden Nugget | $54,075,808.00 | $44,515,165.00 | 21.5 |
| Hard Rock | $59,213,155.00 | $53,908,418.00 | 9.8 |
| Harrah’s | $24,497,890.00 | $25,123,499.00 | -2.5 |
| Ocean Casino | $44,624,505.00 | $39,940,054.00 | 11.7 |
| Resorts | $17,668,969.00 | $18,718,862.00 | -5.6 |
| Resorts Digital (online-only) | $99,217,987.00 | $43,532,669.00 | 127.9 |
| Tropicana | $33,026,512.00 | $35,101,324.00 | -5.9 |
| Total: | $502,268,020.00 | $432,890,772.00 | 16 |
- Borgata with total gaming revenue of $118.0 million
- Resorts Digital, which reported total gaming revenue of $99.2 million
- Hard Rock with total gaming revenue of $59.2 million
At the time of writing, the NJ DGE has published official revenue reports only through August 2023, as the full year has yet to conclude.
Constantly Growing Gambling Industry in Atlantic City
 While we have official statistics only up to August 2023, more than half of fiscal year 2023 has passed, allowing us to base our projections for Atlantic City’s gambling sector on data provided by the state regulator in New Jersey.
Total gaming revenue generated by casinos, racetracks, and their partners in Atlantic City surpassed $500 million, a milestone the Jersey Shore gambling industry has reached only twice in its history.
During the summer of 2023 (June through August), the industry generated $1.49 billion, a 10.5% increase over the $1.35 billion reported for the same period the previous year. According to James Plousis, chair of the NJ Casino Control Commission, although individual results were mixed, overall GGR for summer 2023 grew, with both casino wins and total gaming win reaching their highest levels in the past decade.
In-person gambling from January through August posted a modest 2.3% increase. Recently, Atlantic City casinos reported that their profit margins for the first half of fiscal year 2023 declined 18%, falling to $281.4 million, while net revenue rose 1.5% to nearly $1.6 billion.
Leading Gaming Revenue Contributors in Atlantic City for 2023
 As established, the gaming industry in Atlantic City continues to grow, reaching record levels in 2023. However, certain sectors outperform others. Based on information from New Jersey’s gaming regulator, online gaming has driven the surge in GGR through August 2023, while land-based gambling has stagnated or declined, showing only minimal year-to-year gains or, in some months, negative growth.
1Atlantic City GGR Market Share in January
In January, the nine casinos operating in Atlantic City completed a 12-month streak of generating more than $200 million in GGR, delivering $211.7 million in wins to the state of New Jersey. Although this figure represented a 15.3% year-over-year increase, it was still a 1.8% decrease from the previous month’s results. Typically, January is the slowest month for land-based gambling, yet the January 2023 numbers signaled a promising start for the casino industry in Atlantic City.
Online casinos in Atlantic City started the year by breaking records, generating an Internet win of more than $150 million for the second consecutive month. Although results varied among operators, the $152.9 million in revenue was a major driver of Atlantic City’s overall gaming growth for January 2023.
Atlantic City’s sports wagering sector posted $72.3 million in revenue for January 2023. Although this represented 20.2% year-over-year growth, it is notable that four of the 13 licensees still recorded a revenue loss in January 2023.
Even though all three sectors saw revenue growth in January 2023, commercial casinos contributed the largest share to Jersey Shore’s total gaming revenue for the month.
2Atlantic City GGR Market Share in February
Unfortunately, commercial casinos in Atlantic City enjoyed almost no increase in revenue in February 2023. The nine casinos reported wins of $215.0 million, reflecting a 1.2% year-over-year increase. According to experts, the revenue slowdown stemmed from the fact that the land-based gambling sector in Atlantic City was still recovering from the global pandemic. Research shows that gamblers continue to wager the same amounts they did prior to the pandemic, but they have changed where they place their bets.
Unfortunately, February was also a slow month for the sports betting industry of Monopoly City, with sportsbooks reporting wagering revenue of $54.6 million. While disappointing, these results were somewhat expected because the month has fewer calendar days, one fewer weekend, and the football season is coming to a close.
Unlike the other two segments, online gambling performed well in February 2023, reporting an Internet win of $142.6 million. Although this figure represented a 6.7% decline from the previous month, it was a 9.7% increase over February 2022. The global pandemic propelled online gambling in Atlantic City to new heights, and since January 2021 the city’s online casinos have failed to surpass the $100 million mark only once, in February 2021.
In February, commercial casinos still accounted for the largest share of the total gaming market in Atlantic City (52.2%), but online gaming came close with a 34.6% market share.

3Atlantic City GGR Market Share in March
The nine casinos operating in Atlantic City recorded revenue of $228.6 million in March 2023, a 5.6% year-over-year increase. Despite this surge in casino wins, the overall performance of the nine licensed operators was rather underwhelming. Four casinos reported lower revenue than in March 2022, one property was flat, and two others saw increases of 3.1% or less.
March was extremely profitable for sportsbooks, with operators banking on wagers placed on college basketball underdogs. Sports wagering revenue reached $93.0 million, the third-highest monthly total in the last five years.
March 2023 was also a record month for online casinos, which generated $165.7 million, a 17.8% increase compared with March 2022. As of this writing, the March record for online casinos has yet to be broken, with the sector representing 34% of Atlantic City’s total gaming share for the month.
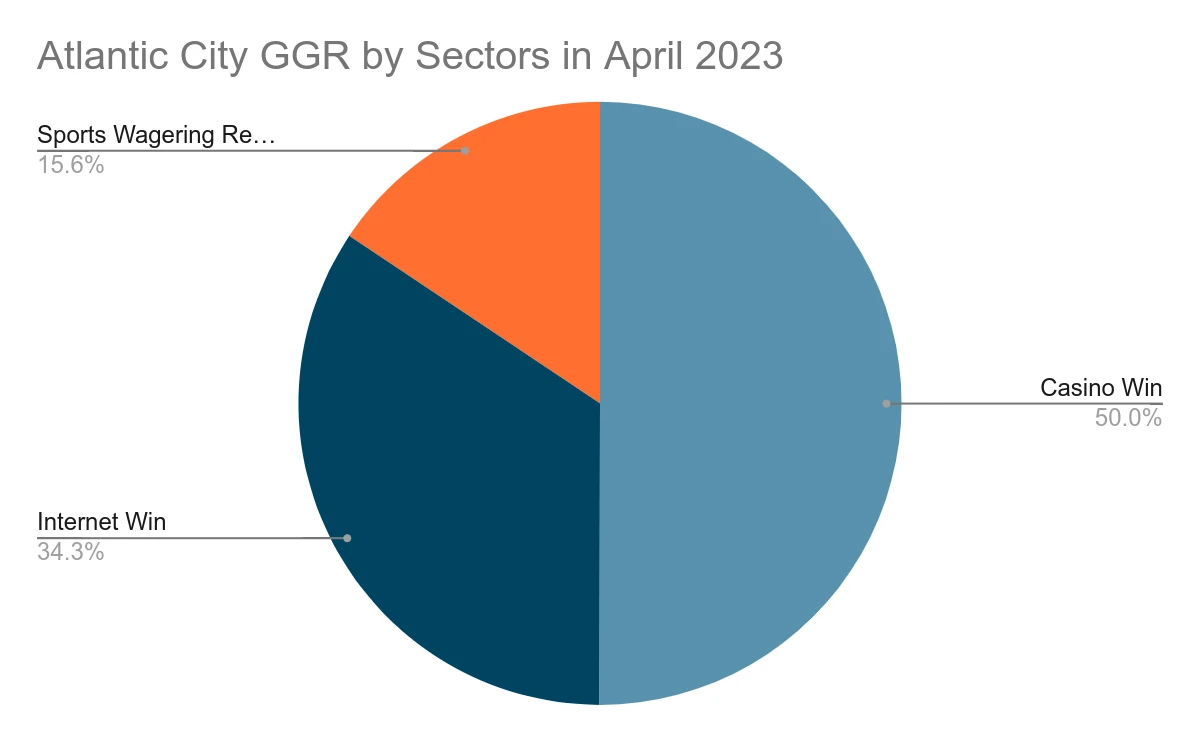
4Atlantic City GGR Market Share in April
April was another slow month for Atlantic City’s land-based casino sector, with the nine licensed operators reporting $231.5 million in revenue. This figure represented a decline from April 2022 and only a slight uptick over the prior year-to-date total. Only two properties posted revenue growth, and one of the industry’s top performers reported a decline.
Although April could not match March’s record-breaking numbers, Internet gambling generated $158.9 million in revenue for the month, a 16% increase compared with April 2022. The sports wagering sector also saw a decline in handle, as bettors spent less on sports wagers in April 2023 than in April 2022. Even though the amount wagered in April 2023 fell by more than 10%, sports wagering revenue reached $72.3 million, a year-over-year increase of more than 43%.
5Atlantic City GGR Market Share in May
May brought a revenue decline for most commercial casinos in Atlantic City, meaning that the sector faced a second consecutive month of decreased earnings. The nine casinos in Monopoly City reported $227.3 million in wins, a 2.4% year-over-year drop. Seven of the nine licensees saw lower in-person gambling revenue. The silver lining is that land-based gaming in Atlantic City has now surpassed 2019 levels. However, as more players shift to online slots and mobile betting, land-based casinos’ popularity is waning, which explains the decline in revenue.
Given the growing interest in online gambling, it was no surprise that the May 2023 Internet win in Atlantic City reached $161.4 million, an 18.7% surge compared with the $136.0 million posted during the same period last year. Although online casinos could not break the March record, they came very close, once again demonstrating the significant impact of online gaming on Atlantic City’s total revenue.
Sports betting also enjoyed a strong month in May 2023, driven largely by basketball wagers. Combined sports wagering revenue for Atlantic City’s licensed sportsbooks reached $82.2 million, a 13% increase over the previous month and a 33.4% year-over-year rise.

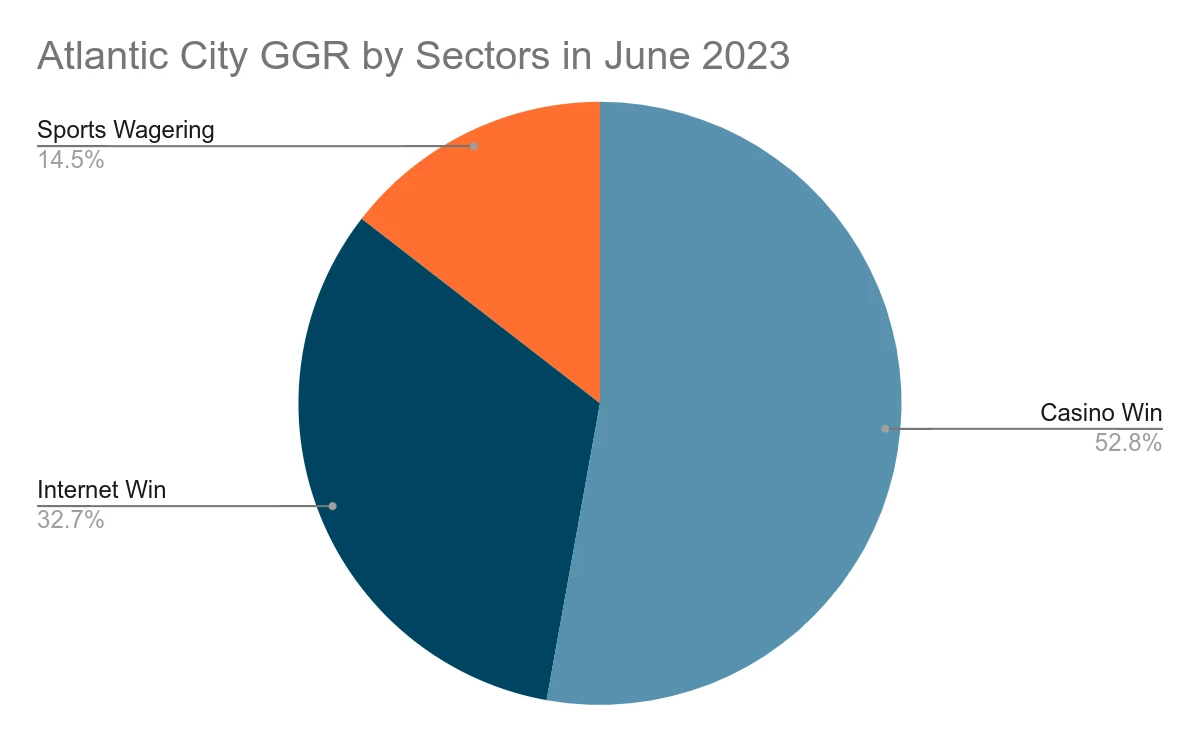
6Atlantic City GGR Market Share in June
With summer being the busiest season for Atlantic City casinos, June brought Monopoly City a solid increase in GGR. With a casino win of $241.6 million, the nine licensed casinos recorded a 5.4% jump over June 2022. Five of the nine licensees reported revenue growth, contributing to the sector’s overall rise. In-person gambling in June accounted for more than 52% of the city’s entire gaming market.
Online gambling maintained its rapid growth, and results from the first half of 2023 surpassed those from the same period in 2022. According to data released by the NJ DGE, the eight licensed online casino operators and their partners generated $149.3 million in June revenue. This figure represented 12.1% year-over-year growth but fell short of both the previous month’s total and the record high posted in March.
The sports betting sector also posted gains in June 2023, with sports wagering revenue of $66.4 million. This figure marked a 69.1% increase over the $39.3 million generated in June 2022. Unfortunately, the revenue boost was tempered by a 6.6% decline in the number of wagers placed, the lowest handle since August 2022.
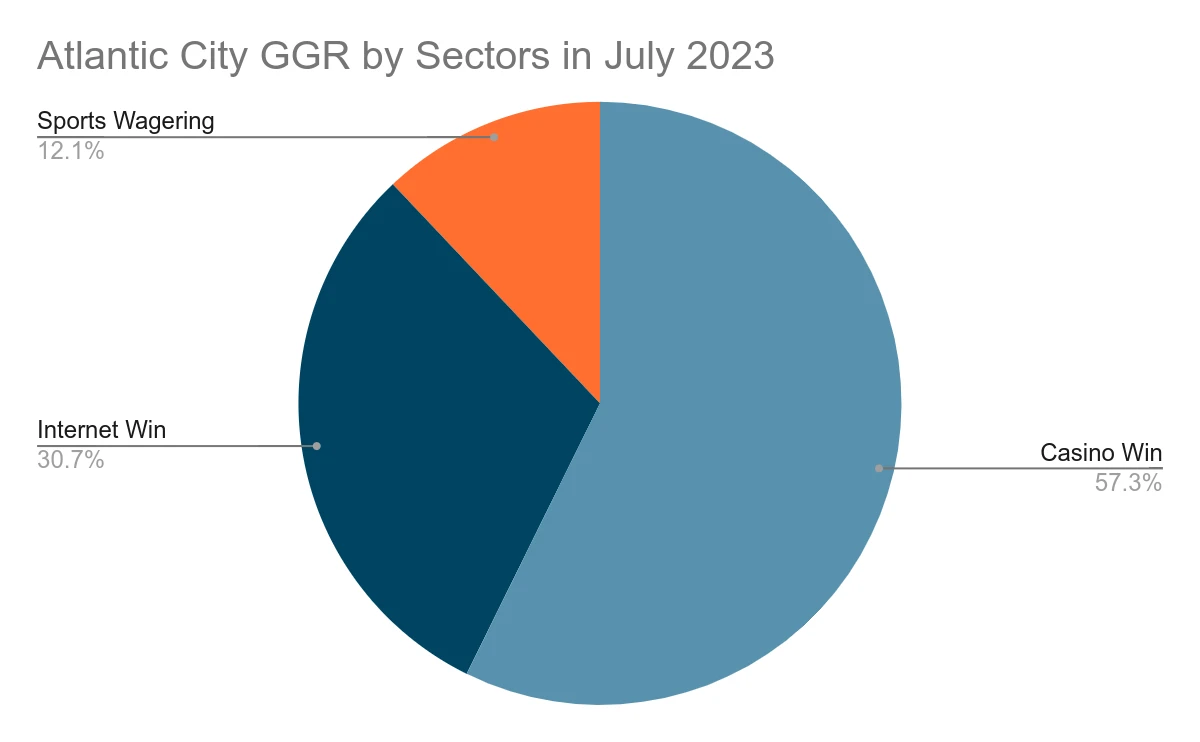
7Atlantic City GGR Market Share in July
Casino operators saw a 3% revenue decline in July 2023, which is understandable given that only three properties posted year-over-year growth compared with July 2022. The nine casinos reported $290.0 million in revenue, down from $299 million the previous July. Nevertheless, land-based casinos continued their gradual recovery from the pandemic, with July 2023 revenue 4.5% higher than in July 2019.
While in-person gaming still held the largest market share in July 2023, online casinos reported a 13.5% year-over-year increase, with revenue of $155 million. Year-to-date online casino revenue surpassed the $1 billion mark in July 2023, reaching $1.085 billion, a 14.2% increase over the same period the previous year.
July was also a strong month for sports betting, as Atlantic City sportsbooks generated $61.0 million in wagering revenue. Compared with July 2022, this result represented a 35.6% year-over-year increase. Although July 2023 produced the lowest monthly handle since the previous August, the total handle still rose by 10%, with $587 million in bets placed.
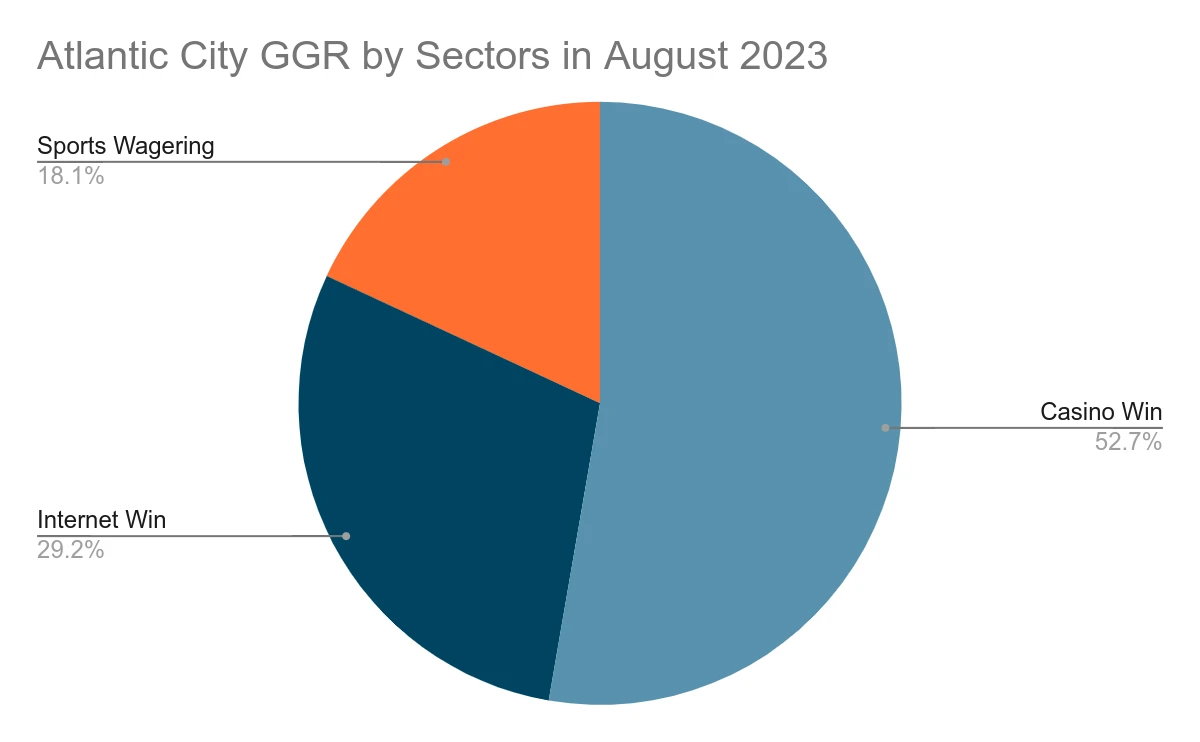
8Atlantic City GGR Market Share in August
The end of the summer season was extremely successful for Atlantic City’s gaming industry, with all land-based casinos, online gaming operators, and sportsbooks reporting revenue growth in August 2023. The nine commercial casinos posted $280.3 million in revenue, a 2.3% increase compared with August 2022. For the eighth month of the fiscal year, five of the nine casinos reported year-over-year revenue growth. In August 2023, land-based casinos still held the largest share of total gaming revenue.
Online casinos also maintained their upward trajectory, with the eight licensees reporting an Internet win of $155.3 million. Compared with August 2022, this figure represents an 18.1% year-over-year increase. Year-to-date online casino revenue exceeded $1.24 billion, pointing to a continuing run of record-breaking results for online gaming in Jersey Shore.
August brought another increase in sports wagering revenue, highlighted by Resorts ending Meadowlands Racetrack’s 54-month streak as the top performer in Monopoly City. Atlantic City sportsbooks reported $96 million in revenue, a 47.1% jump over August 2022.
Based on revenue statistics published by the NJ DGE, land-based casinos retained the larger share of total gaming revenue during the first eight months of 2023. Even so, the sector continues to struggle to reach pre-pandemic levels as many customers have shifted to online gaming and betting. With online casino revenue rising consistently, the online gaming sector is clearly making an ever-growing contribution to Atlantic City’s overall GGR.
Effects of Possible Casino Expansion in New Jersey and Launch of Casino Gambling in New York
 As explained in the introduction, in 1976 New Jersey voters approved legal gambling, designating Atlantic City as the state’s exclusive gaming hub. Today, gambling in New Jersey and Atlantic City gambling are virtually synonymous, with all licensed operators contributing to the state’s gaming revenue based in Atlantic City.
In 2016, a proposal sought to expand casino gambling beyond Atlantic City. Originating from an agreement between Governor Chris Christie and Democratic state leaders, the measure was rejected, with 77% of voters opposing expansion.
A credit-rating analysis by Fitch concluded that expanding casinos beyond Atlantic City could have devastating financial effects on some city operators. Fitch predicted that as many as four licensed casinos could go bankrupt if expansion occurred.
Regarding possible casino legalization in New York, many experts question how this would affect New Jersey’s industry. Some believe that opening casinos in New York City would hurt the Garden State, as players might skip the two-hour drive to Atlantic City.
For comparison, consider mobile sports betting in New Jersey after New York launched mobile betting in 2022. In February 2022, one month after New York’s launch, revenue from New Jersey sportsbooks fell 33% year over year, dropping to just $31 million. This illustrates the potential impact a legalized New York casino industry could have on New Jersey’s gaming revenue in coming years. While New York legislators continue to debate casino regulation, Atlantic City’s industry is watching developments closely.