
 Helen James
In mid-September, two mummified bodies allegedly belonging to aliens were presented at a UFO hearing in Mexico’s Congress, which sparked interest from international media. But the news brought more questions than answers; the scientific community, in particular, panned the findings as fake.
In February, the United States and Canada shot down several unidentified objects flying over North America. While some of these were confirmed as Chinese spy balloons, people started wondering whether the phenomena were all man-made or extraterrestrial. All this sparked our curiosity too, and our team decided to check how likely it is to spot a UFO in Canada. Moreover, which provinces and cities have the highest odds of UFO sightings?
Our team at SuperCasinoSites looked at the per-capita sightings since 2000 for all provinces and territories of Canada using data from Washington State-based non-profit National UFO Reporting Center (NUFORC). We created a map of the areas where UFO sightings have been more concentrated over the past 23 years. We also wanted to see the most current UFO activity, so we also examined the sightings between January 1 and September 10 of this year.
Provinces with the Highest Odds of Seeing a UFO
The NUFORC UFO database includes mostly sighting reports from North America and the UK. As the world’s second-largest country in terms of area, Canada should have a lot of reported encounters with unidentified objects but that is not the case – the U.S. state of California alone has 3 times the number of sightings than Canada. So, we should not look at the area when estimating the likelihood of spotting a UFO; instead, we decided to take population figures into account.
Compared to the United Kingdom, for example, which has a population of around 67 million, Canada with its 37 million residents has many more UFO sightings reported to NUFORC – 3,365 for the UK versus 5,876 for Canada.
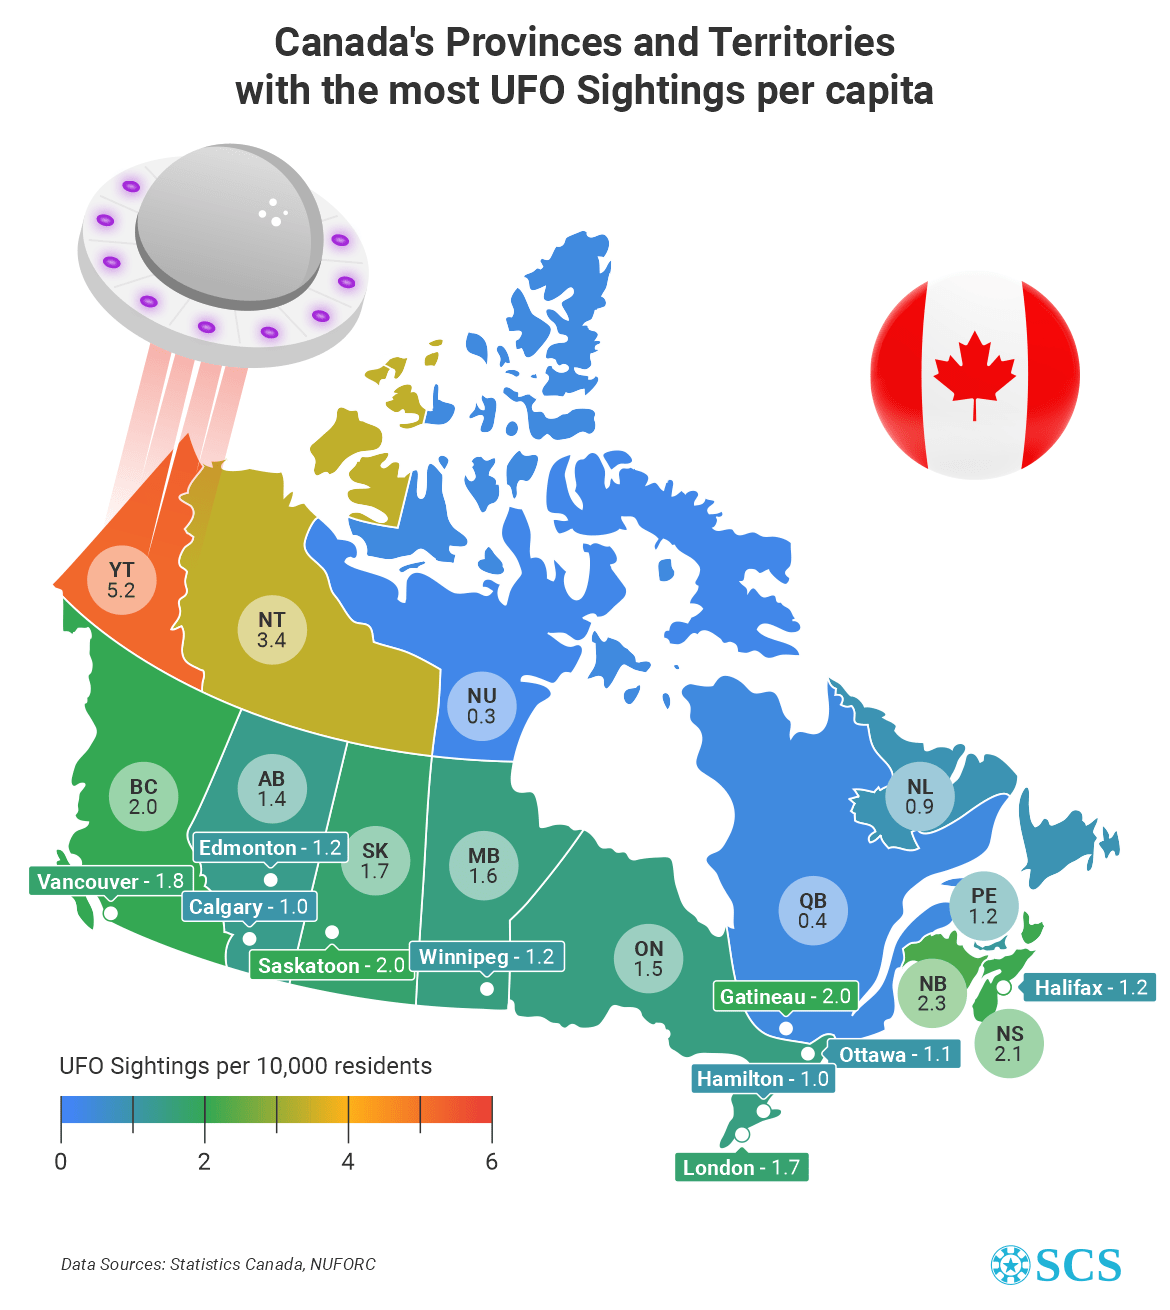
We calculate that the average number of UFO sightings in Canada after the year 1999 is 13.7 per 100,000 residents or 1.37 per 10,000 people. The provinces with the most reported UFOs are Ontario (2,179 reports) and British Columbia (1,025 reports), which is hardly surprising considering their sizable population. Interestingly, Québec has only 371 sightings, much fewer than Alberta’s 611.
The per-capita UFO sighting rate is even more interesting – the highest concentration of UFOs reported is in the Yukon, which has 5.2 sightings per 10,000 residents. Since 2000, the total number of reports is 21 and the city with the most sightings is Whitehorse with seven UFOs spotted in or near the provincial capital.
The Northwest Territories follow with 3.4 sightings per 10,000 residents, with Yellowknife having the most sightings; however, they only record four over a 23-year period. New Brunswick ranks third with 178 UFO sighting reports since 2000 or 2.3 per 10,000 people.
The Canadian provinces and territories where it is least likely to encounter an unidentified flying object are Nunavut (0.3 sightings per 10,000 people), Québec (0.4 sightings per 10,000), and Newfoundland and Labrador (0.9 sightings per 10,000).
UFO Sightings Across Canada In 2023
Despite the widely reported recent increase in UFO sightings in the media and on social media platforms, figures for 2023 show that not many people have reported observing a UFO. According to the NUFORC database, the total number of UFO sightings between January 1 and September 10 of this year is 83 in Canada.
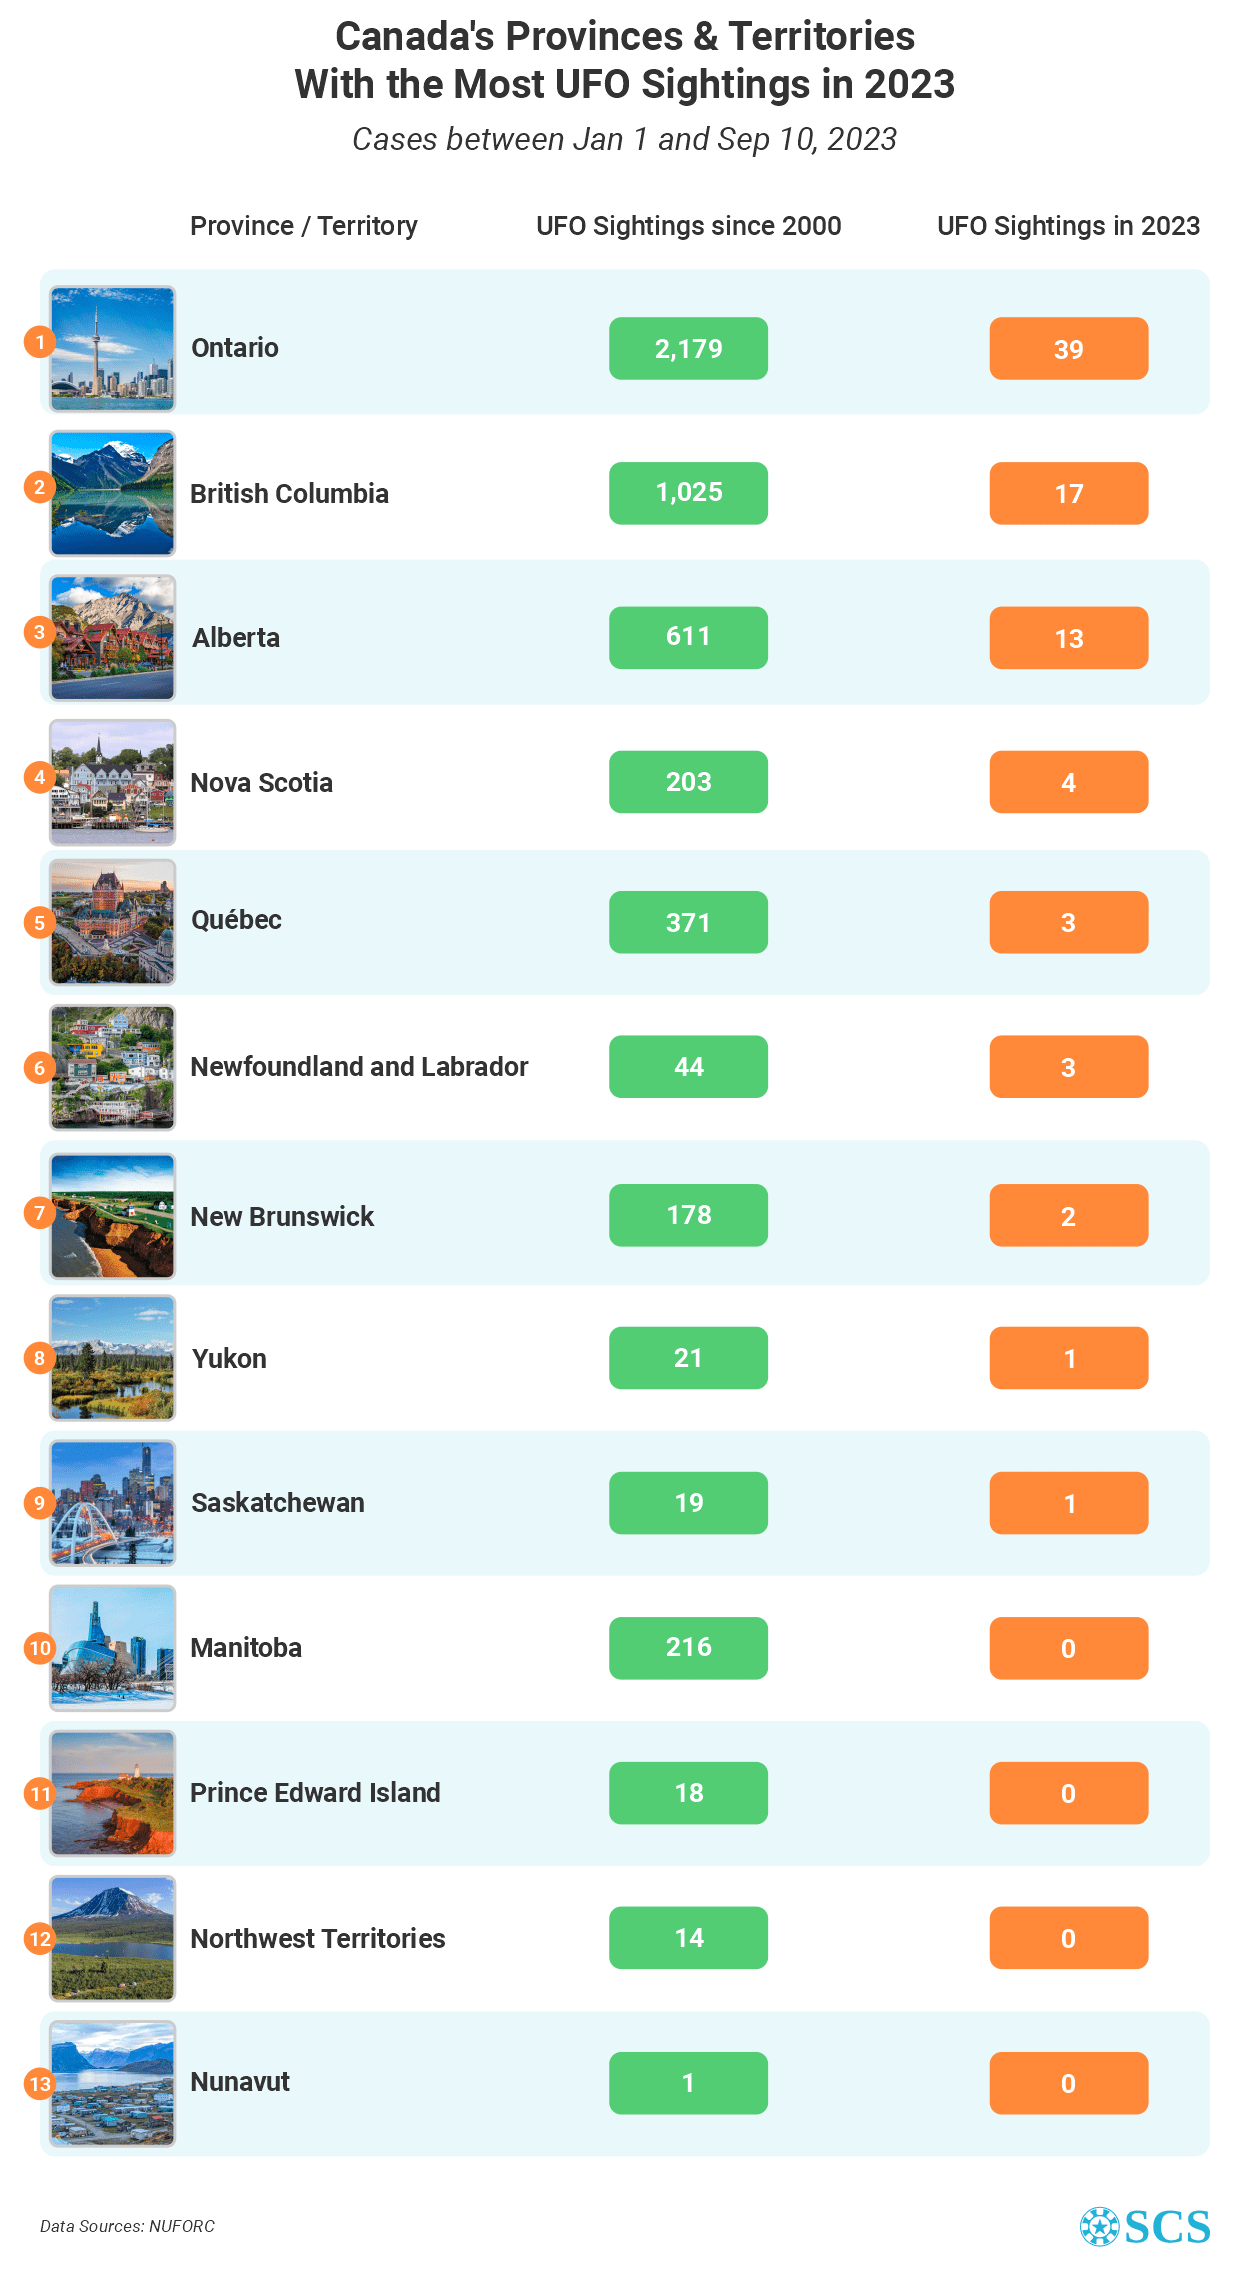
Ontario leads with 39 cases, followed by British Columbia with 17 and Alberta with 13. No UFOs have been reported in Manitoba, the Northwest Territories, Prince Edward Island, and Nunavut.
Cities with the Highest Odds of Seeing a UFO
Which cities in Canada are you most likely to spot a UFO in the skies? The NUFORC files include the city where a UFO has been seen. We did not count the number of UFO sightings reported in all towns and cities, because that would take too long. Instead, we checked how many reports there are for the 20 most populous cities in the country. We ranked them by the number of UFO sightings per 10,000 residents.
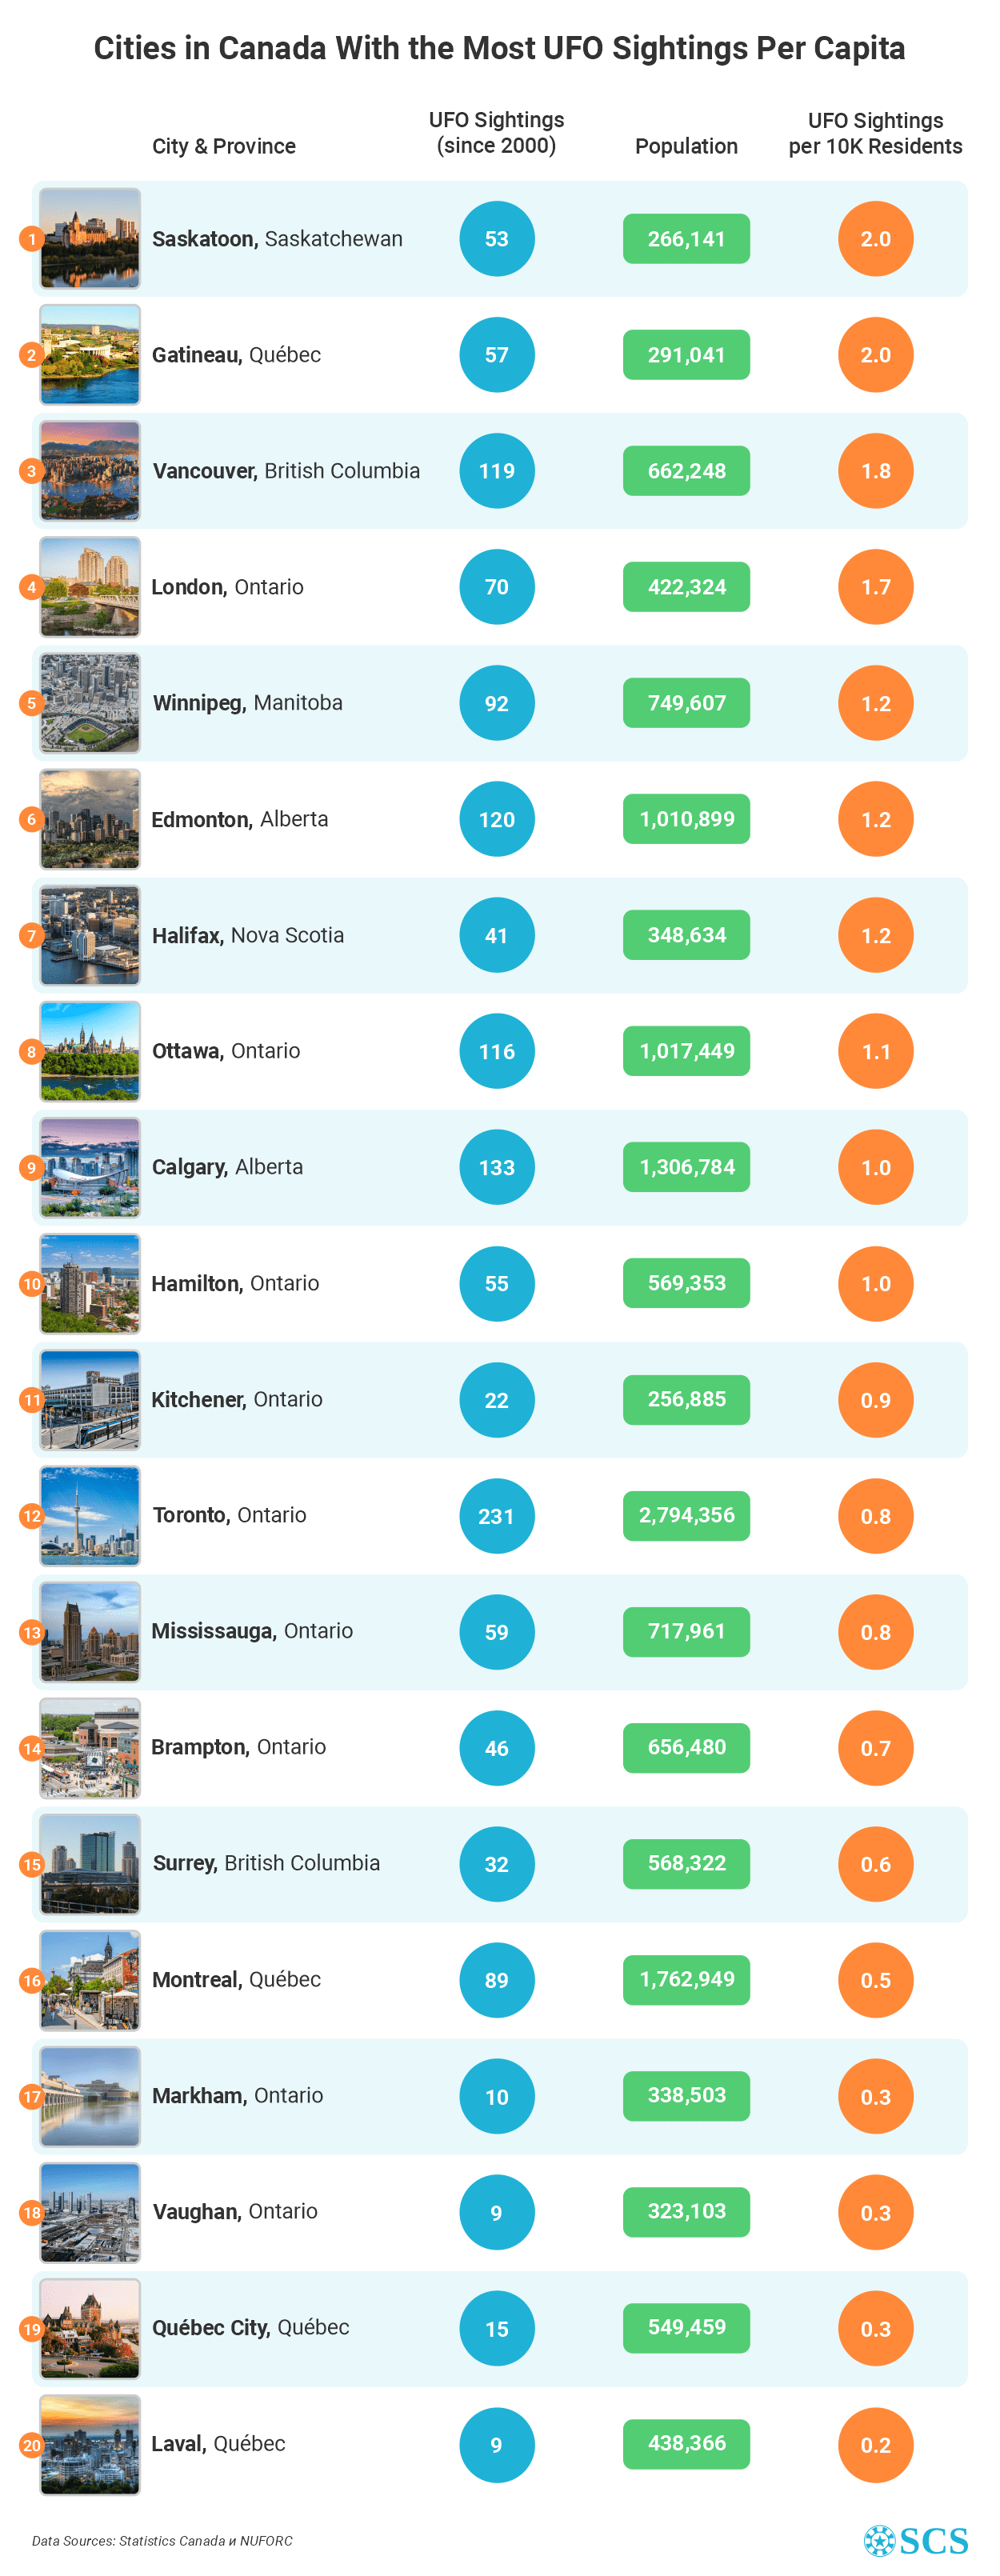
The city with the most sighting reports per capita since 2000 is Saskatoon, Saskatchewan, with 53 reports or roughly 2 per 10,000 residents. Second on the list is Gatineau in Québec with slightly fewer sightings – 1.96 per 10,000 people, while Vancouver in British Columbia ranks third with 119 sightings or 1.8 reports per 10,000 residents.
What Are the Most Common UFO Shapes?
According to the NUFORC database, UFOs are most frequently described in Canada as simply “light.”. This is the most common shape in the reports for all provinces and territories, except for Prince Edward Island where four of the objects were described as light and another four were reported to look like a “fireball”. In Nunavut, there has been only one reported sighting since 2000 – in Rankin Inlet, and its shape was reported to be “changing”.
Other common UFO shapes are circles, triangles, spheres, and disks, while some of the most interesting descriptions are cones, egg shapes, flashes or objects that appear as crosses in the sky.
Methodology
There are several databases of reported sightings of unidentified flying objects available online. The largest and most comprehensive one, however, is the National UFO Reporting Center, which stores more than 170,000 reports of suspected UFOs from all over the world. More importantly, it is a reputable source of information and its data is available to the public for free.
For our study, we looked at all sighting reports from Canada after January 1, 2000, which at the time of writing totalled 5,071. Four incidents were excluded because they did not specify the location of the sighting (city or province). The number of all reports for Canada was 5,876, which means that only 801 sightings occurred between the 1930s and 2000.
For the population figures, our team looked at the latest data from the 2021 Census of Population available on the Statistics Canada website.